
A look back, a look forward, and STATS-DC
This year marks the 5th anniversary of Civilytics Consulting (founded 8/28/2016). Five years is undoubtedly a milestone – one that most of the times I was sure I’d make it to but not always! When I founded Civilytics, it was with a five-year plan in mind. My plan was to build a sustainable practice tackling projects that reflected my values for how data and social science should inform policy. And we’ve done that. So in this newsletter I’d like to share a bit about that journey and what comes next.
In this edition of the The Civic Pulse you’ll find:
- Some highlights from our work over the past 5 years
- A preview of what we’re looking forward to in the next 5 years
- A recap of my recent presentation about inverting the dashboard development process for STATS-DC
- New posts on our website about city and police budgets and how to frame numbers for greater understanding
- A link roundup
Happy Birthday Civilytics!
I wanted to use the occasion to reflect on some of my highlights from each year since Civilytics’ founding.
2016, year 0
- Started a fruitful and long-running partnership with the Strategic Data Project (SDP) at the Center for Education Policy Research at Harvard University.
- Working with SDP has provided a wonderful opportunity to stay in contact with my roots as an agency education data analyst while also having an opportunity to problem-solve and support the best education data analyst training program in the country.
2017, year 1
- Built our first dashboard prototype using a process we use today
- Helped launch OpenSDP
- Began cataloging open and authoritative public data sets
2018, year 2
- Advised and developed predictive analytics systems and a training curriculum around prediction in education
- 2nd prize in a Kaggle Competition for automating geospatial analyses of police calls for service data
2019, year 3
- First work resulting in a major publication for the Reveal podcast on the Census and prison gerrymandering
- Co-authored Education Data Done Right (EDDR) volume 1. Volume 2 of EDDR is right around the corner, watch this space.
- Began meeting with community advocacy organizations to learn about policing and safety
2020, year 4
- First major self-publication, Policing the American University
- Built partnerships with education and city budget advocacy organizations across the country
- Presented to and supported many organizations in integrating public data sources to answer social questions
2021, year 5
- Advisor to the Tableau Racial Equity Data Hub
- Hired a new employee
- Caught a $5 billion disparity in ARPA aid
That’s a whirlwind tour. Some projects aren’t included because of confidentiality agreements – so if we’ve worked together and our project isn’t listed, that’s probably why!
Swings and misses
Civilytics’ five year journey has not been a straight path from one successful project to another. I’ve had many unsuccessful grant applications, contracts that have fallen through at the last minute, ideas I thought were great that no one else did (writing Excel dashboards programmatically via R), or that someone else executed 1000x better than me. Some projects got much more attention and success than I ever anticipated and others I wish had more impact than they did (I’m looking at you ARPA funding disparity). And the old-adage about self-employment definitely has applied much of the time: “Working for yourself gives you so much flexibility, you can choose which 50 hours you work each week.”
The Next Five Years
If you’ve been reading The Civic Pulse these past 2 years, then I think you’ve really got a flavor for where Civilytics is going and what I want us to be working on over the next five years. We are hitting our stride in terms of our capacity, skills, partners, and clients to have the impact that I hoped for. We will be doing more projects that allow us to do data analysis in the social world and we will be sharing what we learn as we walk that path ourselves.
This will mean creating technical tools and training to make sure public data is used well and communicated well. It means doing translational research that is contextualized by the social forces that shape the data and models, and setting an example by keeping our data analysis and research projects democratic and accountable in a world where power is more and more concentrated. And, of course, The Civic Pulse will continue. What started out as the only way I could think of to spread the word about EDDR has grown into one of the most enjoyable and important parts of our work. Thank you for reading.
STATS-DC Presentation
91 people joined our Friday morning STATS-DC presentation, Using Data to Improve Educator Diversity and Understand Students’ Access to Teachers of Color. It was great! A recording of the presentation will be available soon – follow us on social media to stay up to date!
This project is a great example of dashboard development in service of policy and practice changes that are focused and stakeholder driven. The Talent Office at the Connecticut State Department of Education supported by REL Northeast and Islands began by doing a lot of excellent work with stakeholders. When I came onto the project, I knew we had to take advantage of that existing knowledge and work and carry the needs, advice, worries, and excitement stakeholders had through the design process.
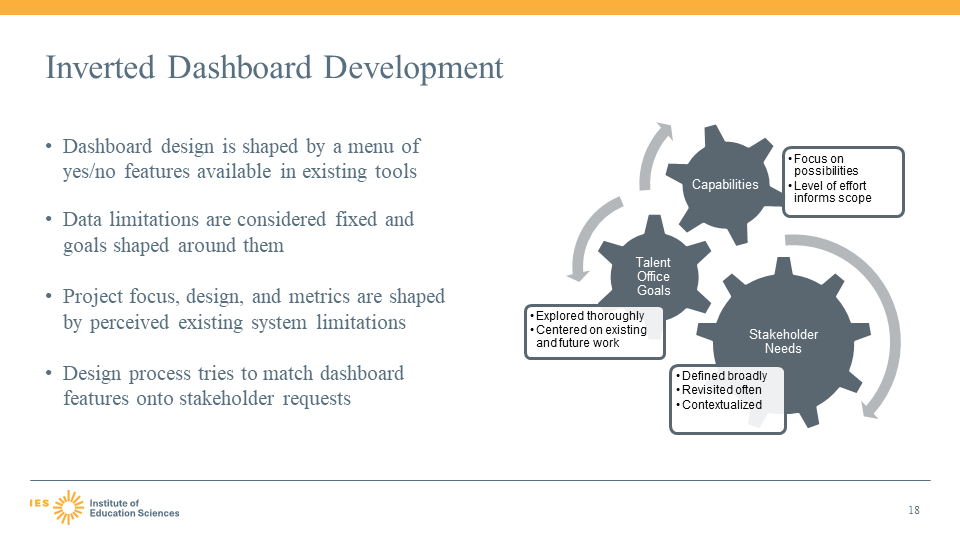
I call this “Inverted Dashboard Development” where a prototype is used to identify and make concrete the needs of stakeholders, and the program area responsible for the dashboard synthesizes that feedback and presents it to the developers. The key here is that the prototype is a more free and creative space than the final product design (which will be limited by time, tech, and funds) but the initial design phase with stakeholders helps identify which tradeoffs to make as needed in the final product design.
The process worked out wonderfully in this case as we were able to quickly and decisively work with Connecticut’s IT team to identify our top priorities and find ways to align the production system with the elements of the prototype that stakeholders found most valuable.
If you are developing dashboards in your organization, I really recommend you check out the video and think about your process. Also, if you are working on educator equity, the rest of the project is a great example of how to approach strategies for diversifying the educator workforce in a thoughtful and holistic way.
Posts on City and Police Budgets
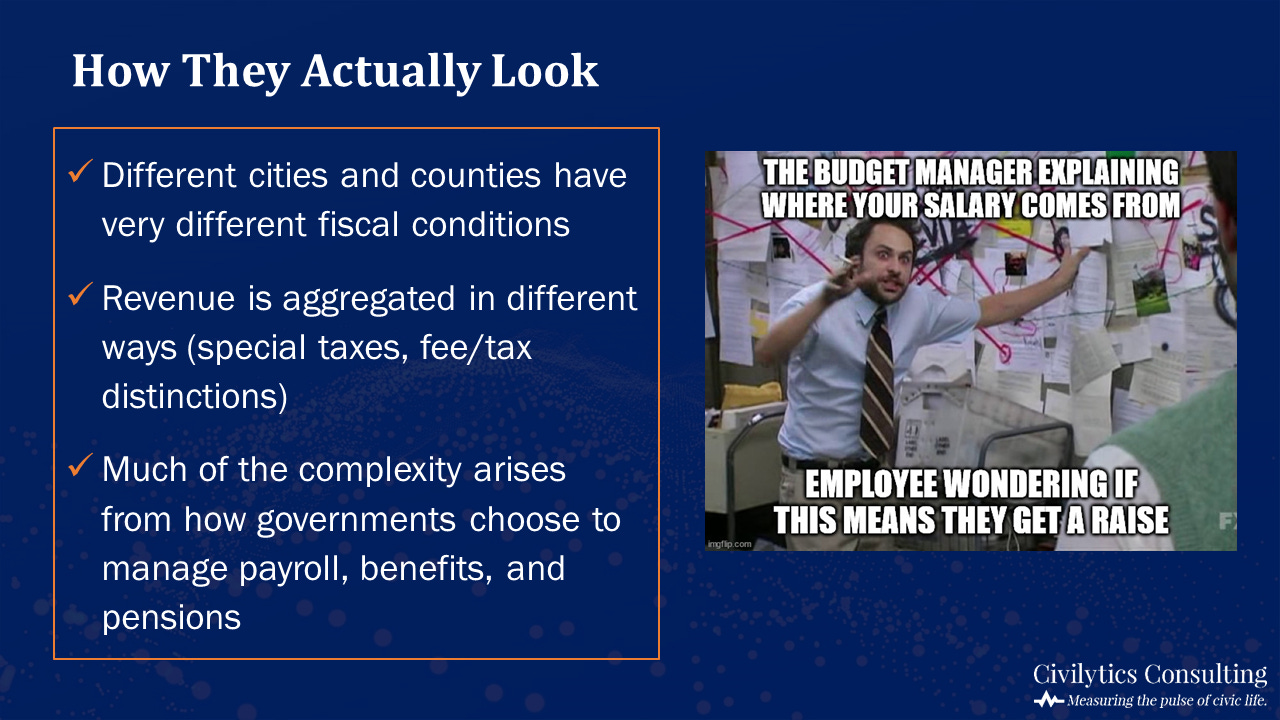
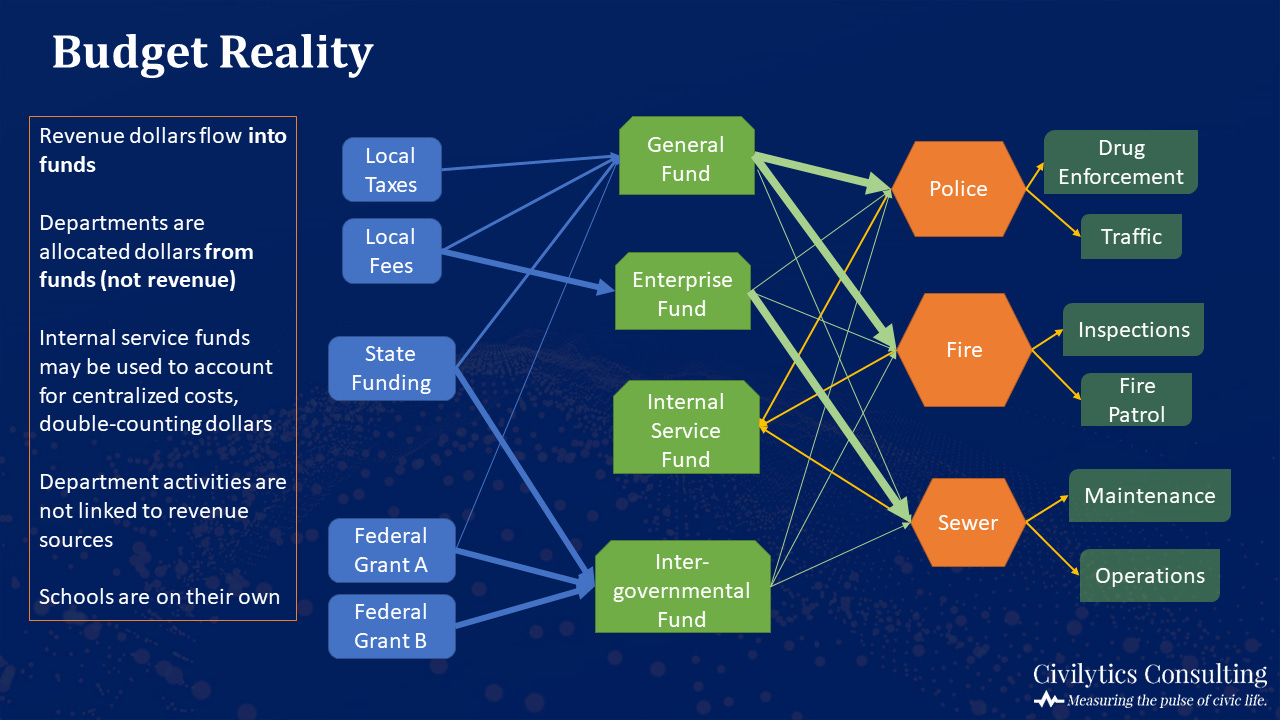
I was invited to present on local budgets to a convening of experts who were focused on a related issue (court fines and fees), and I took the opportunity to test and set some expectations about how local budgets align and misalign with our expectations.
Myths & Realities of Local Budgets + The Cost of Policing
I also talked about how the scales of budgets can be disorienting and hard to contextualize. We try to present budget numbers in multiple ways (nominal, relative, rate, and human) so that the numbers can be used in whichever way best supports analysis, public information campaigns, messaging, and political education efforts. These four different frames are useful no matter what numbers you are trying communicate!
We drew on the presentation for the two posts linked above – check them out if you’re interested.

Epidemiology Music Video
Before the usual link roundup, I want to highlight an essential piece of YouTube viewing brought to you by my friend (and avid Civic Pulse reader), the talented Dr. Paul Creswell. In an era filled with armchair epidemiologists, Paul, a credentialed epidemiologist, has given us all a delightfully funny song and music video about the father of modern epidemiology.
Without further ado, the Ballad of John Snow:
Paul shared this video with me a few months ago and I hope it brings you the smile it has brought me ever since!
Link Roundup
On the reasons Economics is everywhere
One of my guilty intellectual pleasures is the philosophy of science and understanding the role sciences play in our social world. Here’s an interesting, and more empirical than most, look at the incentives leading the field of Economics to push seemingly far afield into other disciplines and what it may mean for policy-relevant social science moving forward.
Where is all that ARPA money going?
Here’s an initial look at a unique dataset about how some cities are planning to spend their ARPA dollars. It is early days, but cities are inventing processes for allocating the funds on the fly and looking at one another for ideas, so this kind of coverage is critical.
What the experts say on academic impacts of COVID-19
There’s a lot of discussion about “learning loss” due to the ongoing COVID-19 pandemic. My conceptual issues with the terminology aside, this short article by The Center for Assessment is really useful in understanding and communicating the magnitude of the effects on achievement scores (highlight: 2-4x the impacts found from Hurricane Katrina in 2006).
History never stops being uncovered
On September 5, 1791 a much wealthier contemporary of James Madison, George Washington, and Thomas Jefferson walked into a courthouse in Northumberland County and freed more than 500 of his slaves in the largest act of emancipation until the Emancipation Proclamation seventy years later. This story has a number of fascinating twists and challenges a lot of our accepted history about the relationship of the founding fathers to slavery.
Learning a little more about deep learning
This short review of three papers focuses on how deep learning performs with tabular data (rows of observations and columns of variables as opposed to images, audio, video or other data) compared to other common approaches (linear models, generalized additive models, etc.). The conclusion matches what I’ve found in my work on education prediction systems: deep learning does not provide more than a marginal benefit for many problems and, in some cases, is handily beaten by methods with fewer tunable parameters and assumptions.
As always, we appreciate your help spreading the word about this newsletter. If you haven’t already, please subscribe. If you subscribe, send it to a friend, or share it on social media. And, we love to hear from you! If you’ve got a project you think Civilytics can help with or a question, do get in touch.
With gratitude,
Jared