
I recently presented to a group of academic researchers on the myths and realities of local budgets and police spending and staffing. These are some of the lessons learned from reading and analyzing dozens of city and county budgets in the past 2 years.
I wanted to share some of the presentation takeaways with all of you.
3 Key Elements of Local Budgets: Revenue, Expenditures, and Positions
The first two elements are pretty self-explanatory:
- Revenue is how much the city or county takes in and from what sources.
- Expenditures are how they spend the money.
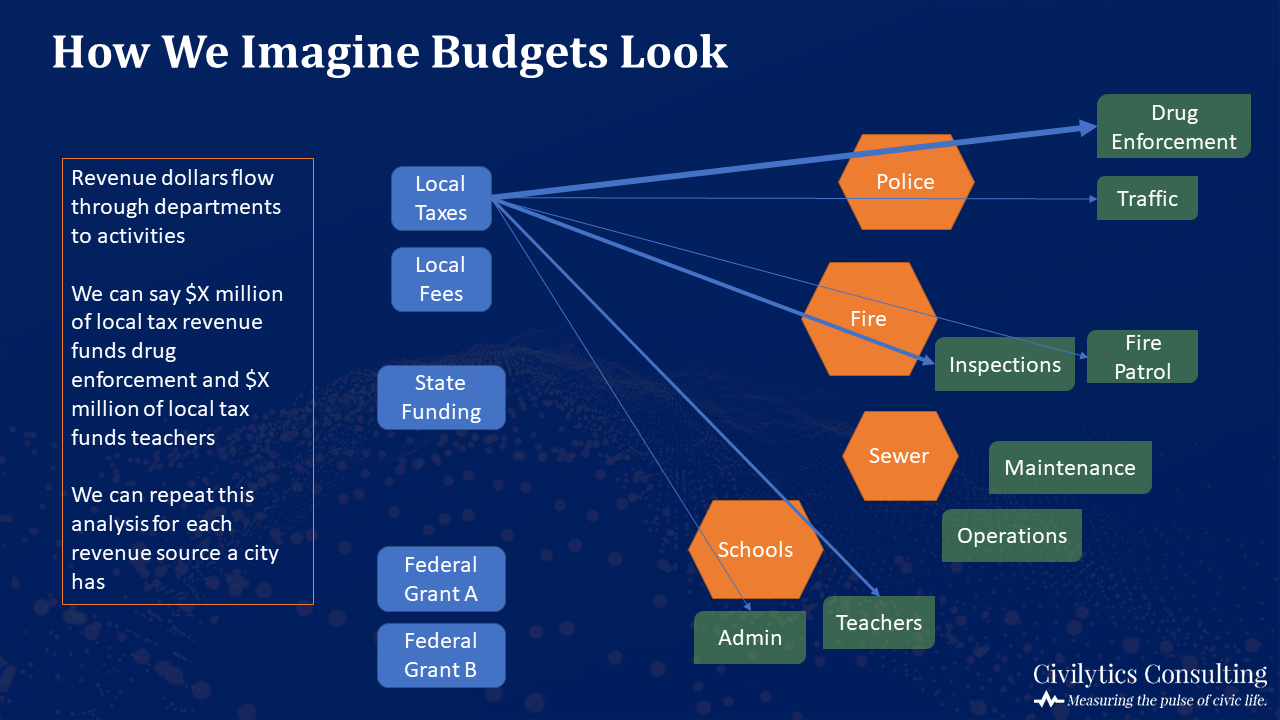
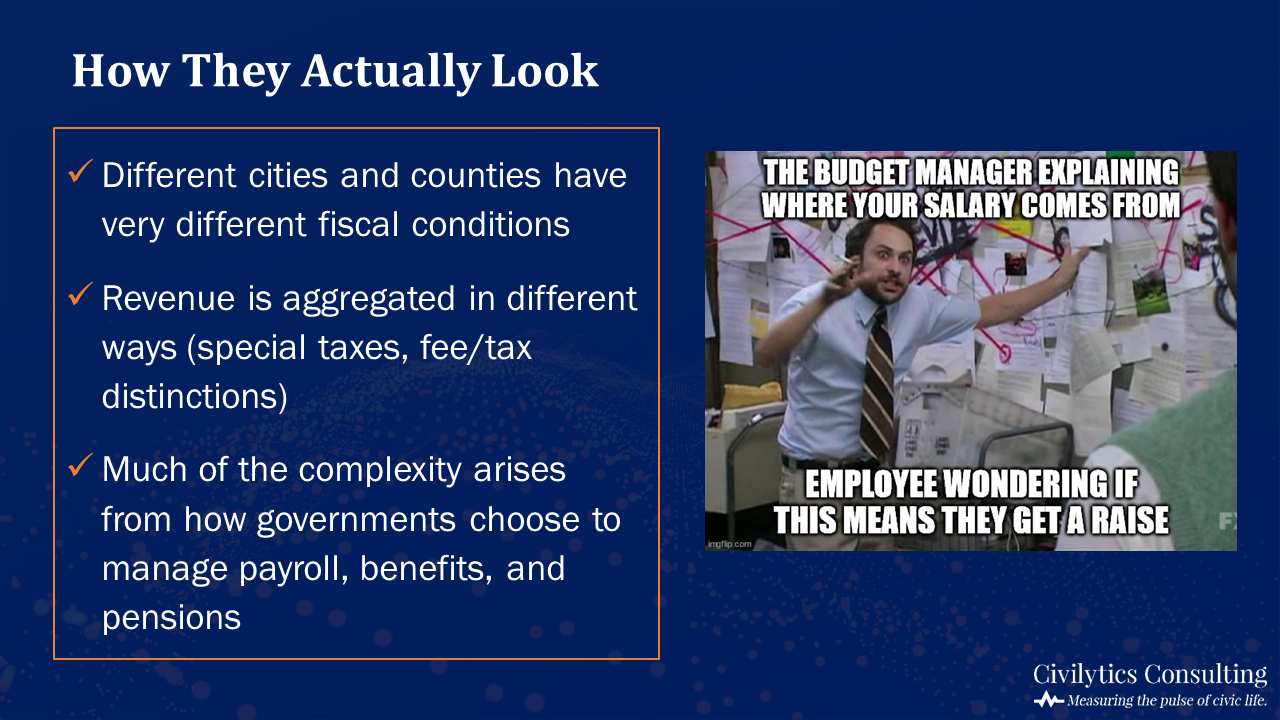
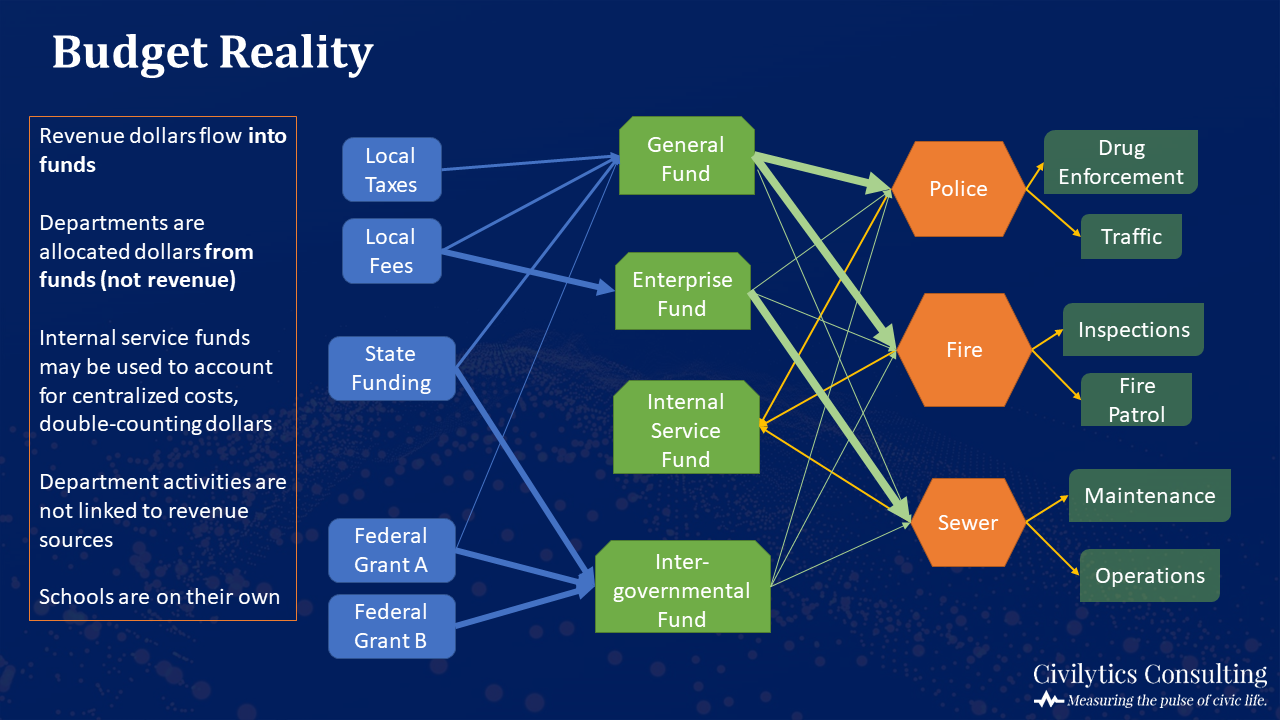
Unfortunately, we often can’t track the revenue or understand expenditures nearly as well as we’d like! For instance, while we might want to know how much of our property taxes fund drug enforcement, most local governments do not track dollars at this level of detail. Instead, revenue dollars flow into funds, money from funds is allocated to departments, and department activities are not linked to revenue sources (or often linked to specific funding amounts either).
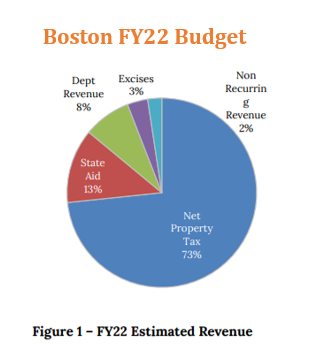
Most Revenue Comes from Local Taxes
The majority of most cities’ and counties’ revenue comes from local taxes with other revenue coming from local fees for water, sewer, and/or solid waste; fines, licenses, and forfeitures; state revenue sharing or state grants; and federal grants.
Which local tax provides the largest share of revenue varies across place — it’s sometimes property tax, sometimes sales tax, and sometimes occupational or earnings tax. (Other local taxes include hotel, gas, utility, franchise, business, alcohol, etc. but don’t usually make up as large of a share of revenue).
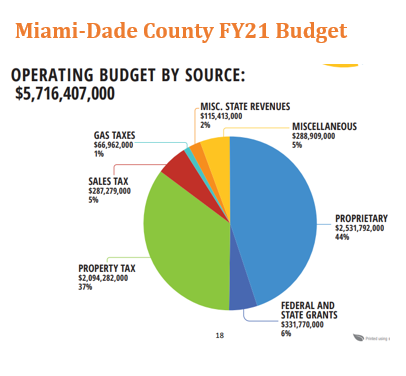
Here are two examples from recent budgets: almost all of Boston’s revenue comes from property taxes, while property taxes make up a smaller share of Miami-Dade County’s budget.
Two Key Questions about Expenditures Can Take You Far
I think community groups can get a good understanding of the impact of policing on their local budget just by answering 2 key questions about expenditures:
- How much city or county money is spent on policing?
- How much does 1 police officer cost?
Defining the Share of Police Spending
Answering the first question requires defining the numerator (what money is spent on “policing”) and the denominator (what money is “city/county money”)?
There are reasonable options to define both in ways that differ from the frame the budget uses.
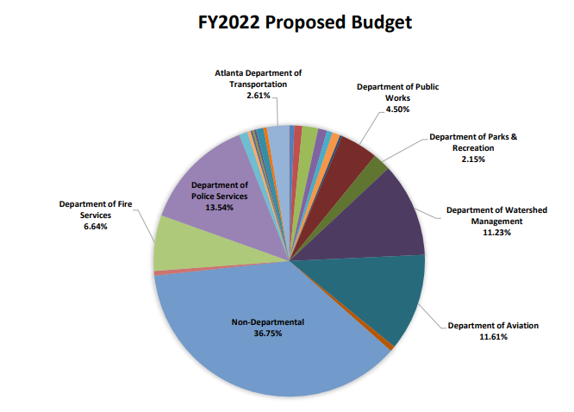
For example, many local budgets count employee benefits and fleet expenses outside of the “home department.” Here are two examples from Durham County (left), which counts employee benefits as “General Government,” and Atlanta (right), which counts employee benefits as “Non-departmental.” Both obscure how much is spent on staffing in general and policing in particular.
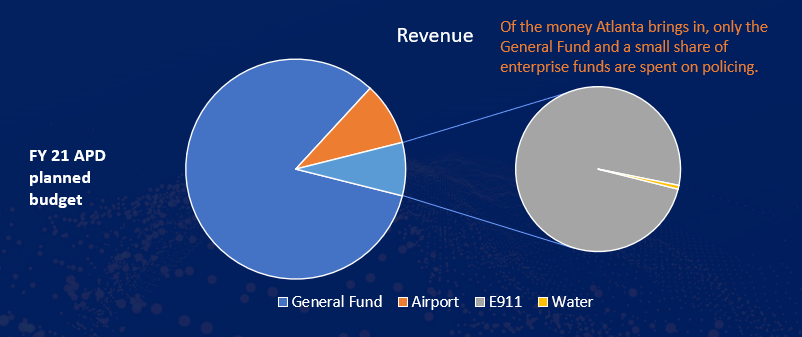
In terms of what money is flexible, discretionary local money — budgets often include “proprietary” or “enterprise” funds as part of the denominator, but these are raised through user fees and service charges and can only be used to provide that service. Including as part of the denominator funds from water and sewer charges (which simply come in for these services and go out to provide them) gives a misleading picture of how much of a city’s discretionary money is spent on policing.
In most cities, all or nearly all of the revenue supporting the police department comes from the city’s general fund.
Identifying the Cost per Officer
It’s important to start with the basic fact that almost all police departments spend 80 to 90% of their budget on staff.
In addition to salary and overtime wages, costs for benefits (including healthcare, sick leave, pensions, SSI/Medicare/Medicaid, equipment allowances, and education bonuses) often add around 50% to the cost of a police officer.
As mentioned above, the cost of benefits can be hard to find since they’re accounted for in many different ways: a separate department may pay the benefit costs for all city employees, departments may pay another department a lump sum for benefits, etc.
After accounting for benefits, we’ve seen total costs of an average officer varying from $46k in Shreveport, Louisiana, to over $150k in Los Angeles.
Staffing/Positions: The Hidden Budget
Understanding the PD org chart, including how many authorized and filled positions the PD has, is a crucial third element of budget analysis.
The first thing to understand here is that a “position” is a budget term for the authority to hire staff.
- A department that has $ but no position authority cannot hire.
- A department that has a vacant position but does not have $ cannot hire.
- Departments need both $ and position authority to hire.
Right now, many police departments are unable to hire all the positions they have authority and money for, creating a surplus of funding (that is then spent on overtime, bonuses, etc.). Vacant positions with funding allocated for them tie up discretionary spending money that could be put to better use elsewhere in the community. The position allocations in your local city and county budget can help you identify when this occurs.
Positions Are Priorities
If you can learn how staff are allocated across the department, you can get a sense of how the PD is spending its time and what activities are prioritized.
Unfortunately, non-descriptive division, bureau, and unit names can impede this, as can a lack of staffing data by unit. For example, Miami-Dade’s largest division is simply called “Police Services,” making up 50% of the department’s budget and 54% of the department’s staff. Miami-Dade’s second largest division is simply called “Support Services.” No further details about activities or units within these divisions are provided.
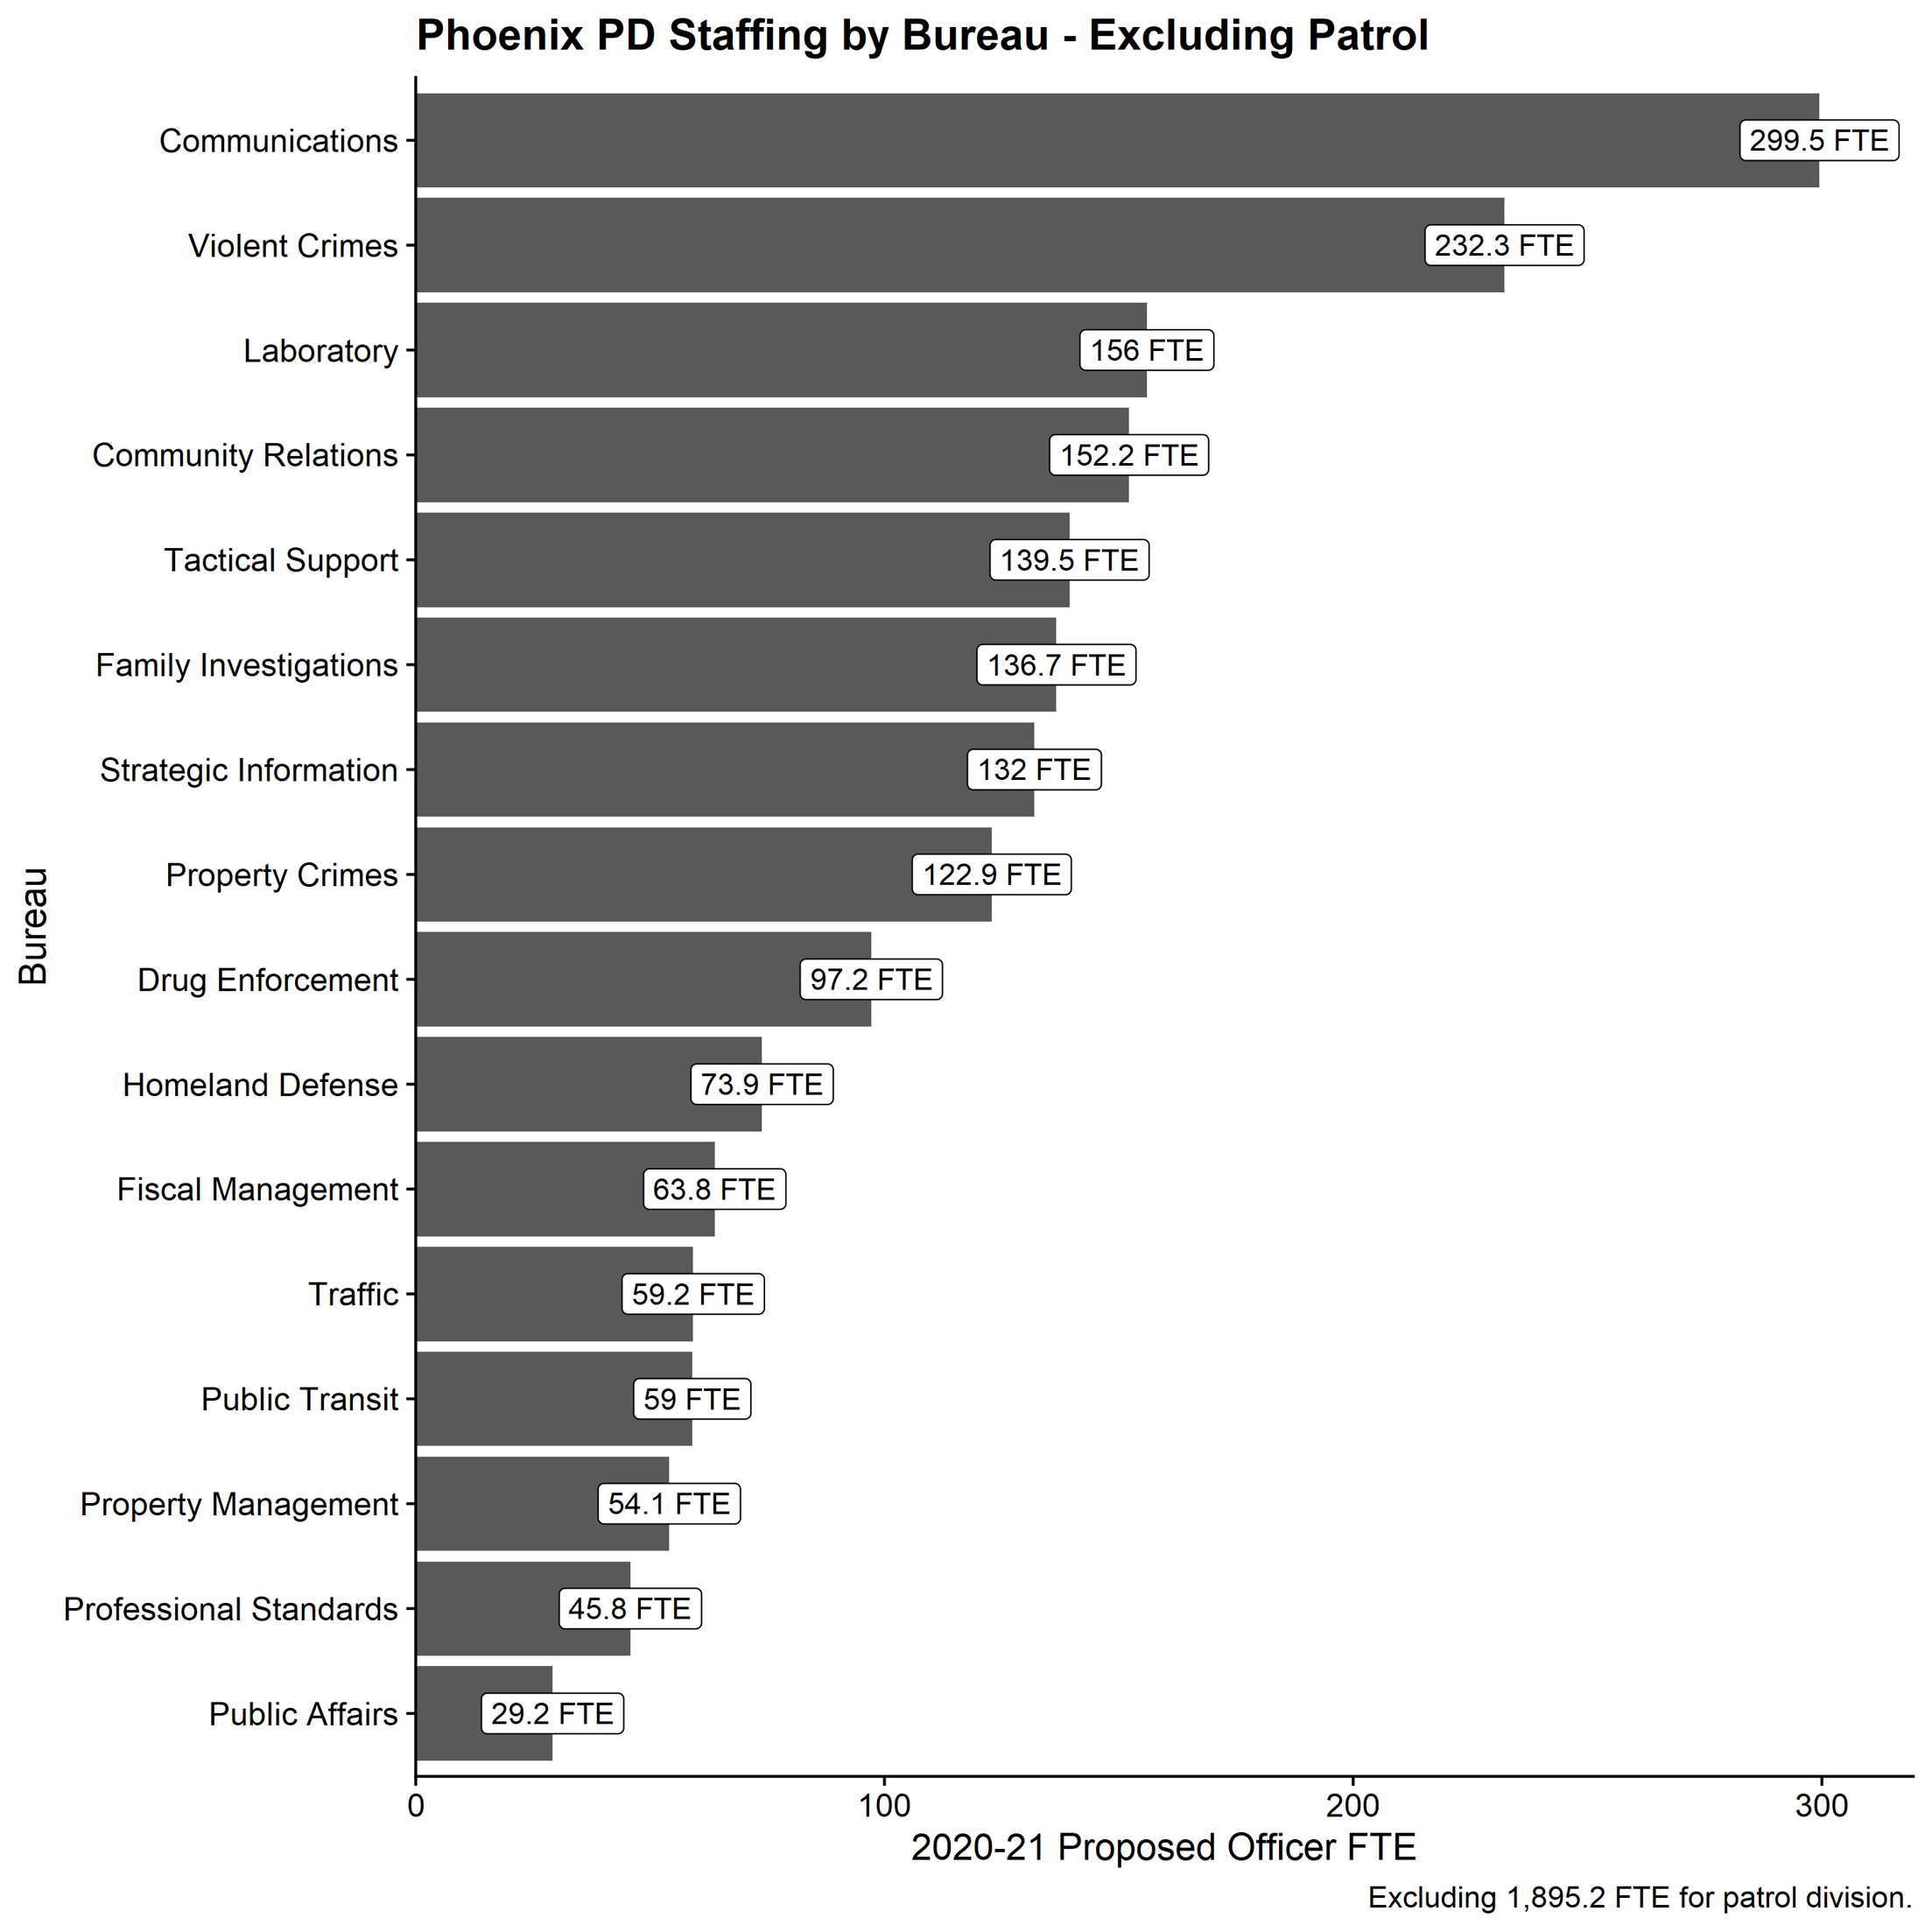
In contrast, one of the best case scenarios is Phoenix, which has a large police department with a clear organizational structure (see below). Even in this best case scenario though, a lot of questions are left unanswered about the role of different bureaus. And that doesn’t even account for patrol, which is almost always the largest bureau/unit and has nebulous responsibilities.
Position Types: Sworn Officers and Civilians
One final note about staffing is the distinction between the two types of positions in PDs: sworn officers and civilians. Civilians are covered by the regular city employee union, have less generous benefits, and do “support” tasks like taking 911 calls, managing data collection, etc. Sworn officers — cops — have arrest and search authority and bargain through the police union or Fraternal Order of the Police (FOP). In many cities and counties across the country sworn officers are assigned duties, like IT, records management, etc. that civilians can do.
Learn More
With just these key ideas, you are on your way to understanding how your local budget operates and what public services are backed up by public dollars. Civilytics has more resources, including a guide to reviewing and changing the police budget in your community, here.
The American Rescue Plan provides an unprecedented expansion of federal funding to support local communities, making local choices about how to spend discretionary funding more important than ever. We encourage you to get involved and let your local leaders know that people are watching the budget closely. Below are some resources to help!
- Federal aid (ARPA) resources
- Community programs to build safe and healthy communities (part 1) (part 2)