

Update (6/29/2021): We’ve published our full methodology in part 3 including how you can recreate this analysis using official data sources and why it took so long to figure out.
In Part I we showed that the decision to allocate non-entitlement unit (NEU) funding based on the non-metro population rather than the NEU population led states with large unincorporated populations (like Nevada and California) to receive more funding per NEU resident than other states with no one or almost no one living in unincorporated areas (like New York and Massachusetts).
In fact, the original text of the bill that became the America Rescue Plan Act (H.R. 1319) stated that NEU aid to the states should be distributed based on the NEU population:
“(B) Allocation and Payment. From the amount reserved under subparagraph (A), the Secretary shall allocate and pay to each State an amount which bears the same proportion to such reserved amount as the total population of all nonentitlement units of local government in the State bears to the total population of all nonentitlement units of local government in all such States.”
H.R. 1319 Sec 602 (2) (B) (emphasis added by author)
But, in the final law, the language for the same section was changed:
“(B) Allocation and Payment. From the amount reserved under subparagraph (A), the Secretary shall allocate and pay to each State an amount which bears the same proportion to such reserved amount as the total population of all areas that are non-metropolitan cities in the State bears to the total population of all areas that are non-metropolitan cities in all such States.”
Public Law 117-2, cited by Treasury, (emphasis added by author)
It appears this change came via Senate Amendment 1398 (pdf pages 111-116) proposed by Senator Schumer (D-NY) together with Senators Wyden, Murray, Brown, Peters, Cardin, Cantwell, Stabenow, Tester, Menendez, Schatz, Carper, Leahy, and Sanders as part of the reconciliation process with HR 1319.
Changing these 5 words led to over $5 billion (25% of the total allocation for NEUs) shifting between states.
We’ll now look at the consequences of this change from the House bill language to the final enacted law.
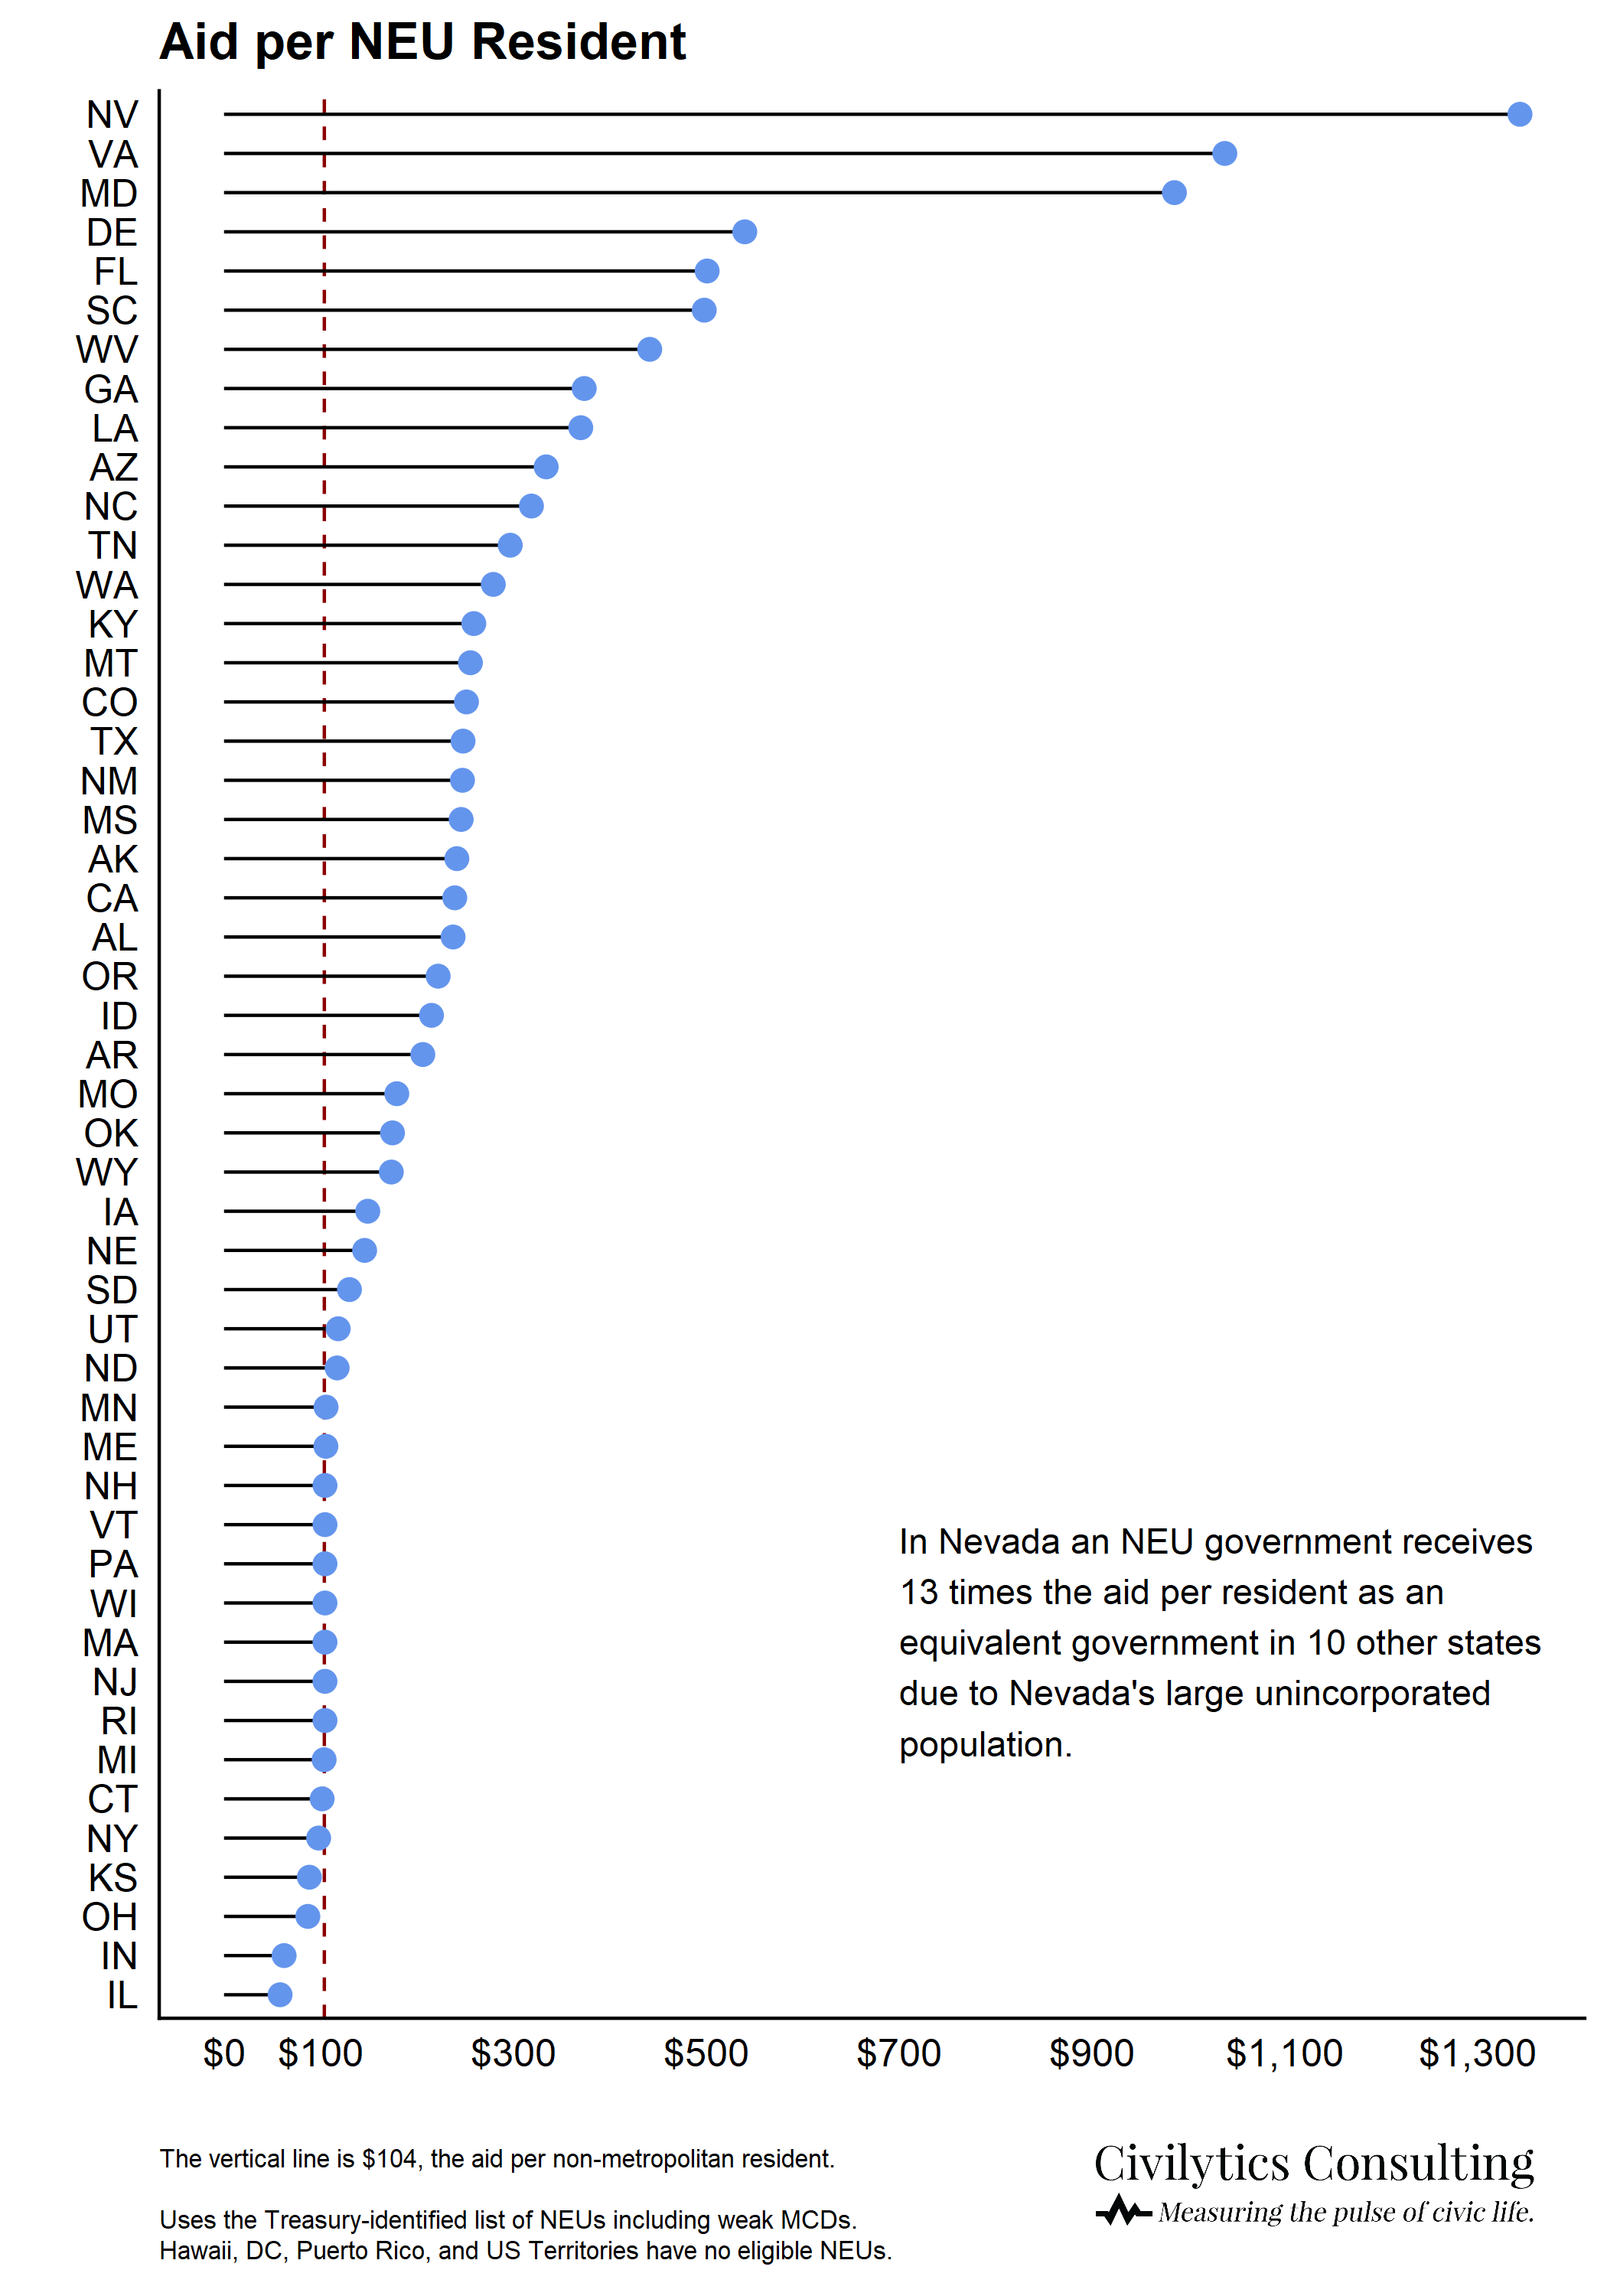
As we mentioned in Part I, in NY, MA, PA, CT, and many other states, NEUs are set to receive about $104 per resident in ARPA funds. In VA, MD, and NV, NEUs are set to receive over 10 times as much per resident. Other states are somewhere in the middle as shown in the graph below from Part 1.
House Approach: Equal Amount for all NEU Residents
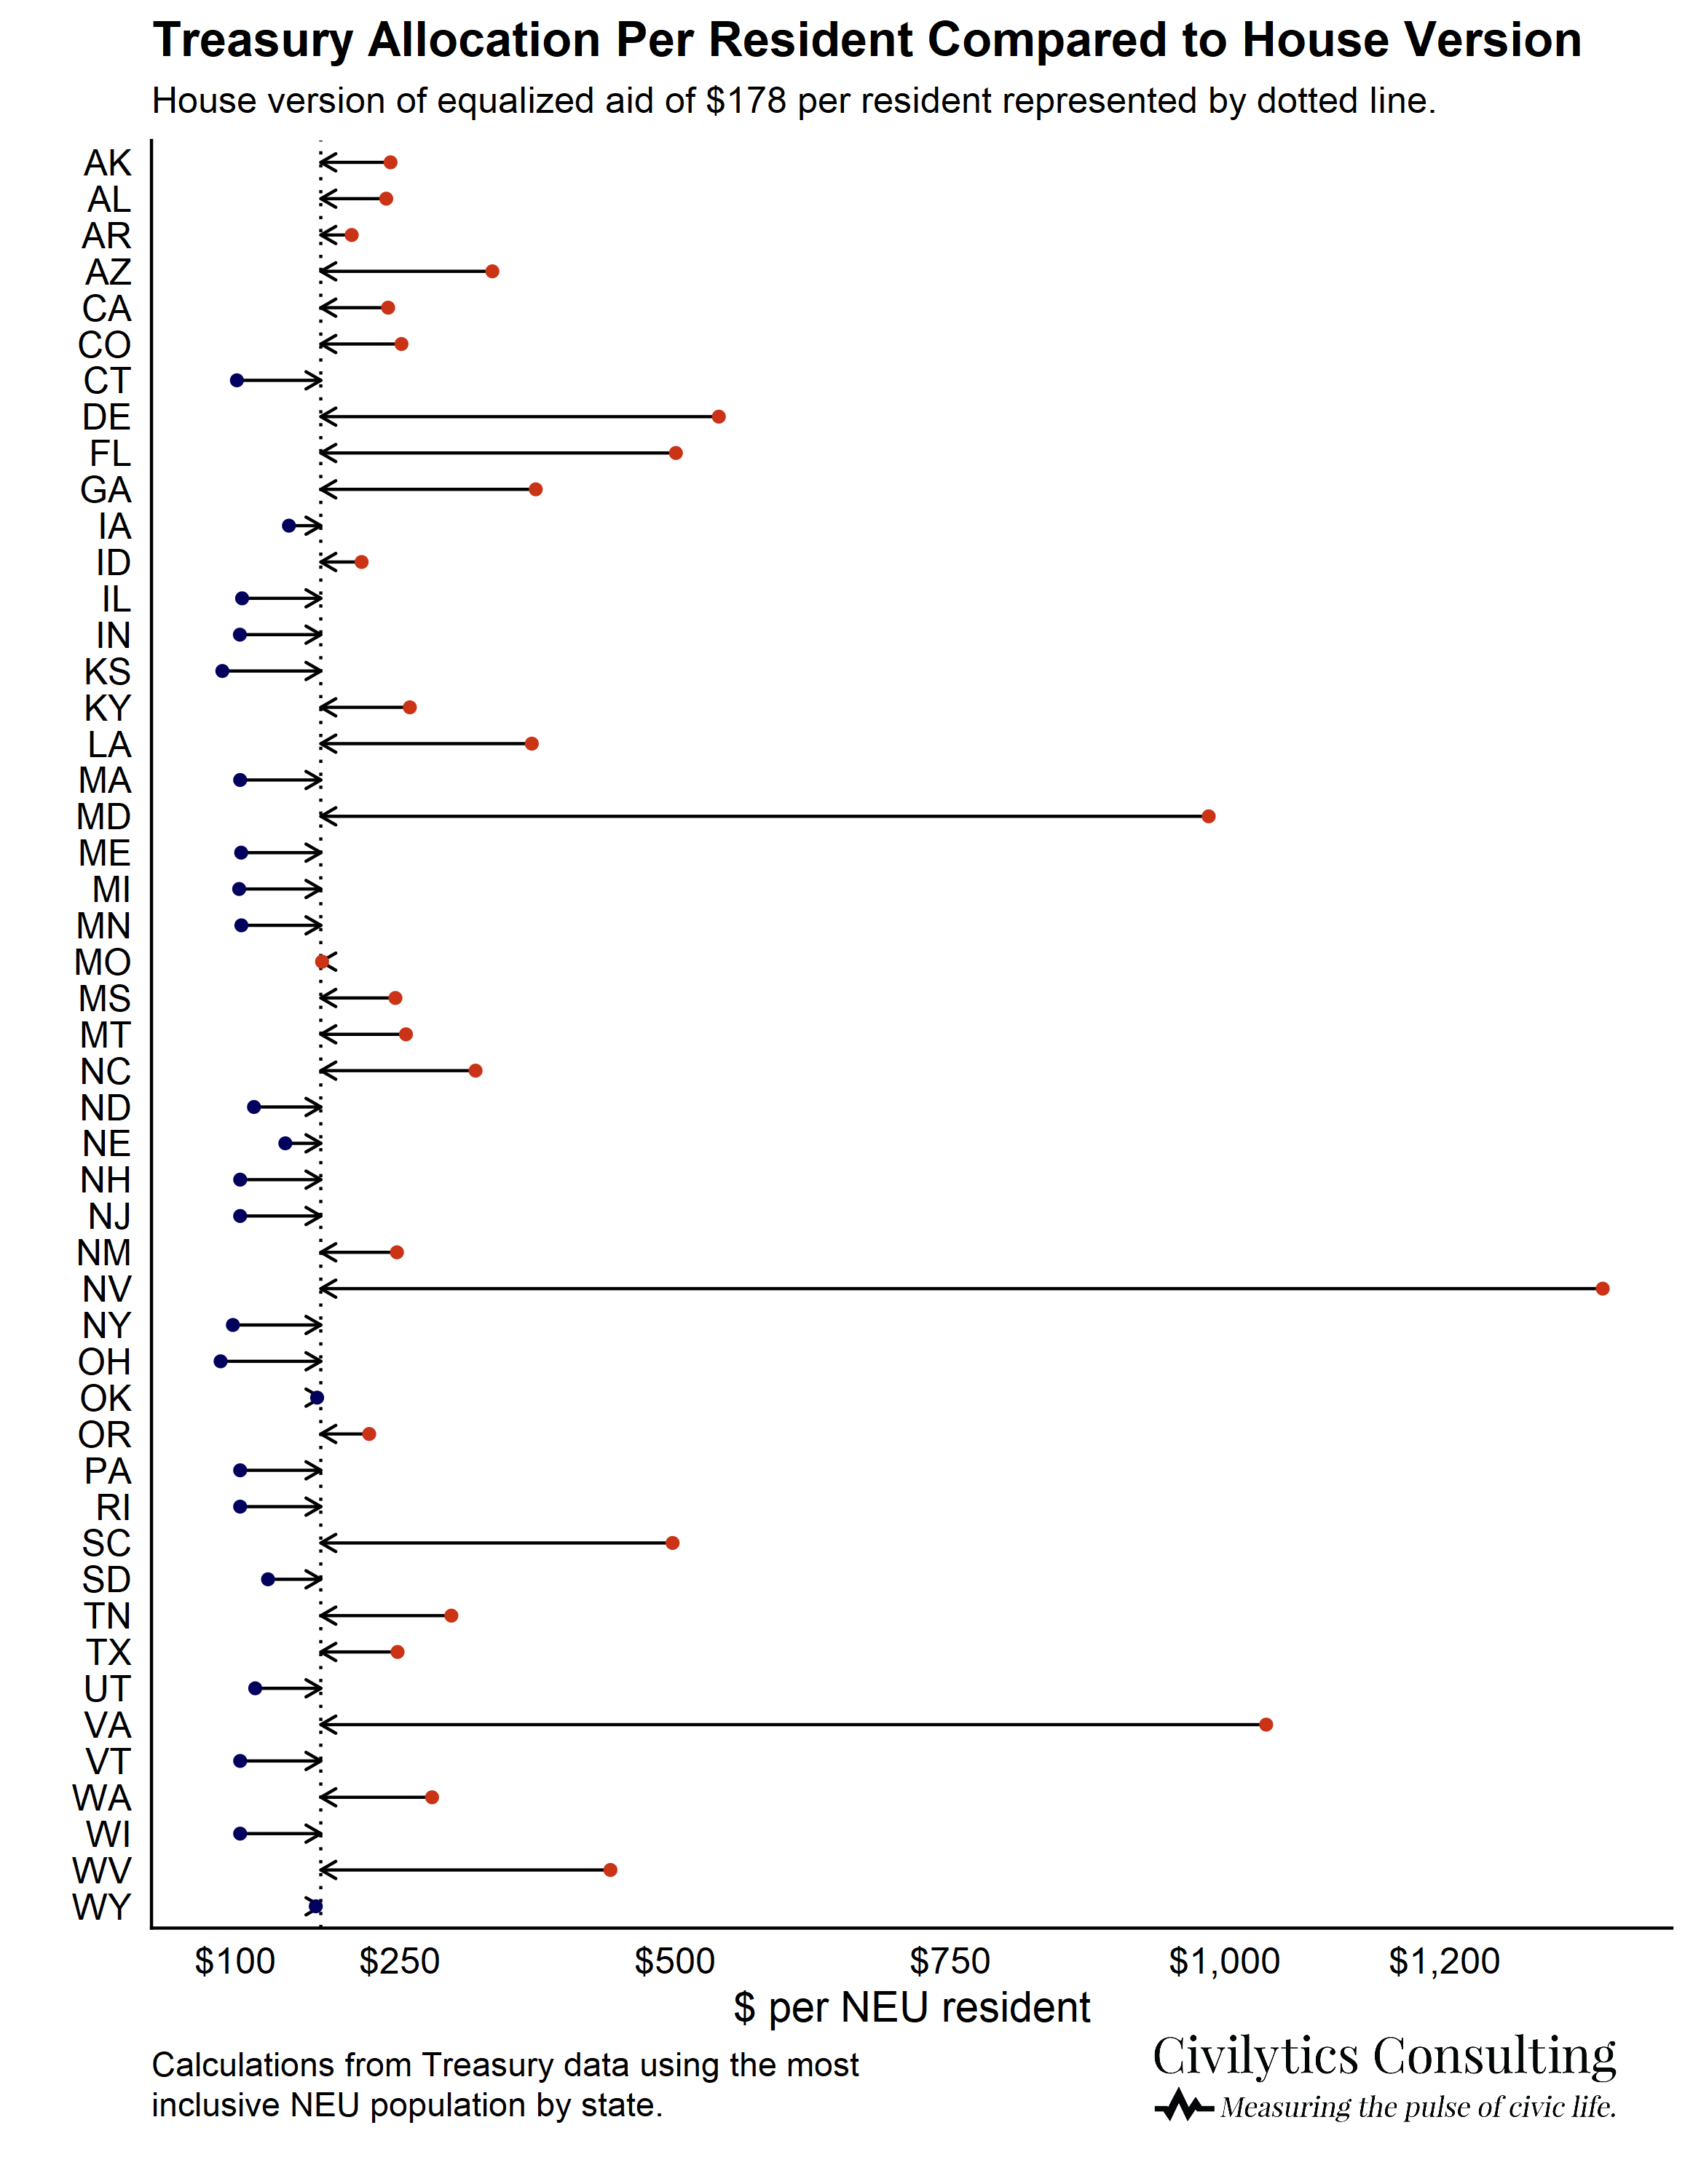
Under the House approach, each NEU would have received the same amount per resident regardless of state. The House bill distributed funds based on the share of NEU residents in each state, rather than the share of non-metro residents. This approach kept the populations consistent at both the state and local level — federal funds would be allocated based on NEU populations and then states would pass those funds through to local governments based on NEU populations. Under this approach, each NEU would receive about $178 per resident, regardless of state.*
Using the NEU populations provided by Treasury, we can easily calculate the alternative funding allocations had ARPA not been amended to change the allocation method.
Let’s take our three example cities from the prior post. Under the House approach, they’d all receive the same amount per resident — which means Milford, CT, would receive much more than under the Senate approach (the enacted law), and Azusa, CA, would receive much less.
| Population | Senate Approach: Total Aid | Senate Approach: Aid Per Resident | House Approach: Total Aid | House Approach: Aid Per Resident | |
| Milford, CT | 54,747 | $5.6M | $101 | $9.5M | $178 |
| Azusa, CA | 49,974 | $12.0M | $239 | $8.6M | $178 |
| Stillwater, OK | 50,299 | $8.8M | $174 | $8.7M | $178 |
How Does This Shift $5 Billion?
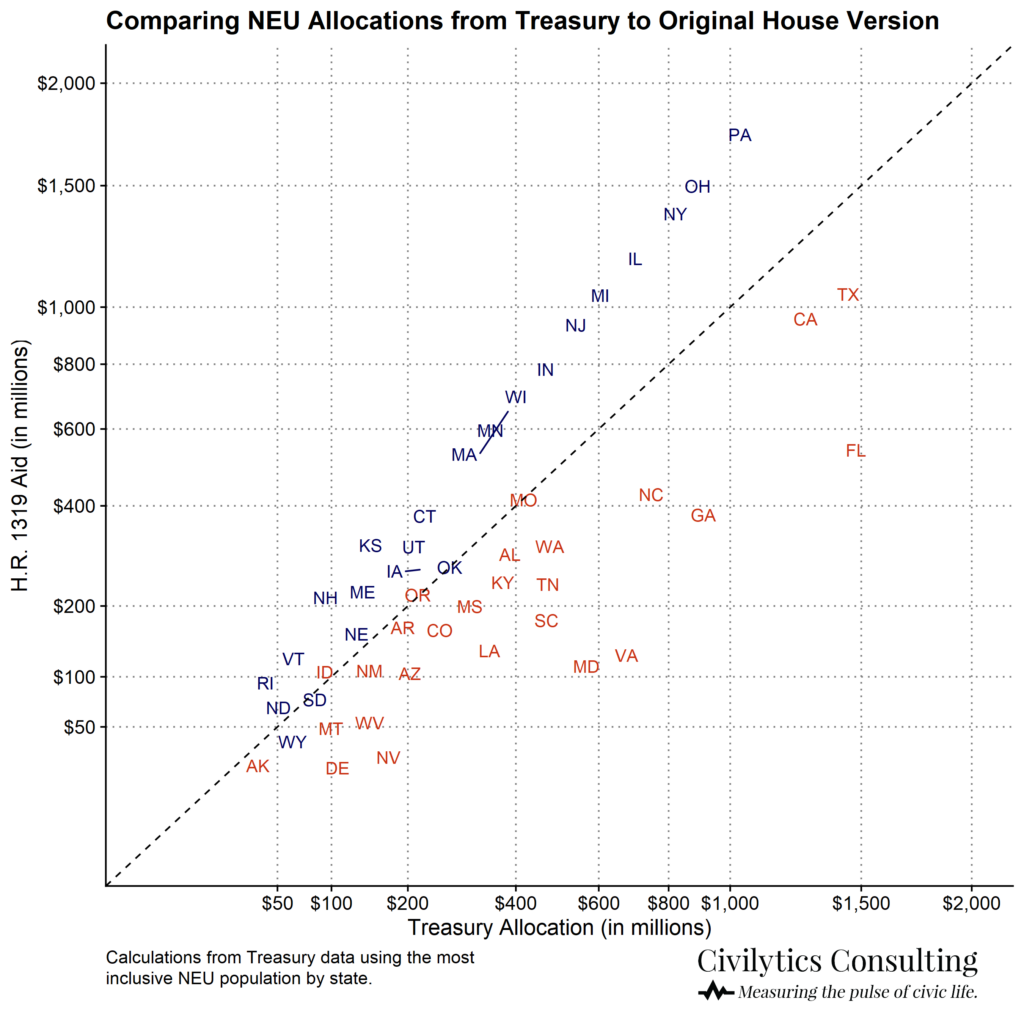
States that are above the dotted line in the graph below would benefit from the alternative “flat” (House) approach. PA would benefit the most, receiving almost $689M more to distribute to NEUs than under the current formula. NY, OH, and IL would also benefit substantially, receiving $500M – $600M more for their NEUs.
FL would lose the most, over $900M, though NEUs in FL would still be receiving the same amount per resident as those in other states (rather than 5 times more per resident).
On a per resident basis, the House approach fixes the distortion we discussed in Part I. Now every NEU resident “counts the same” and their government receives an equal amount of aid for them (while residents of unincorporated areas are no longer included in the aid distribution formula).
At the state level, the implication is that states where every non-metro resident lives in an NEU would get more funds, while those with many residents living in unincorporated areas would get less.
At the local level, small cities and towns in some states with few NEUs (particularly in NV, VA, and MD) would lose a significant amount of funding per resident, while many, many, many small cities and towns in some states would get around $70 more per resident.
A final way to look at fund shifts is to look at the percentage change in funding for each state between the House version and Senate (final) version. The graph below shows that, in at least 13 states, NEUs are now getting 40% less aid than they would have received under the House version. For example, CT would have received about $345M under the House version but only receives $203M under the Senate version. PA would have received $1,672M under the House version but only receives $983M under the Senate version.
And, as we’ve said before, NEUs in 3 states (NV, MD, and VA) get 4 times more aid under the Senate version than they otherwise would have under the “flat rate” House approach.
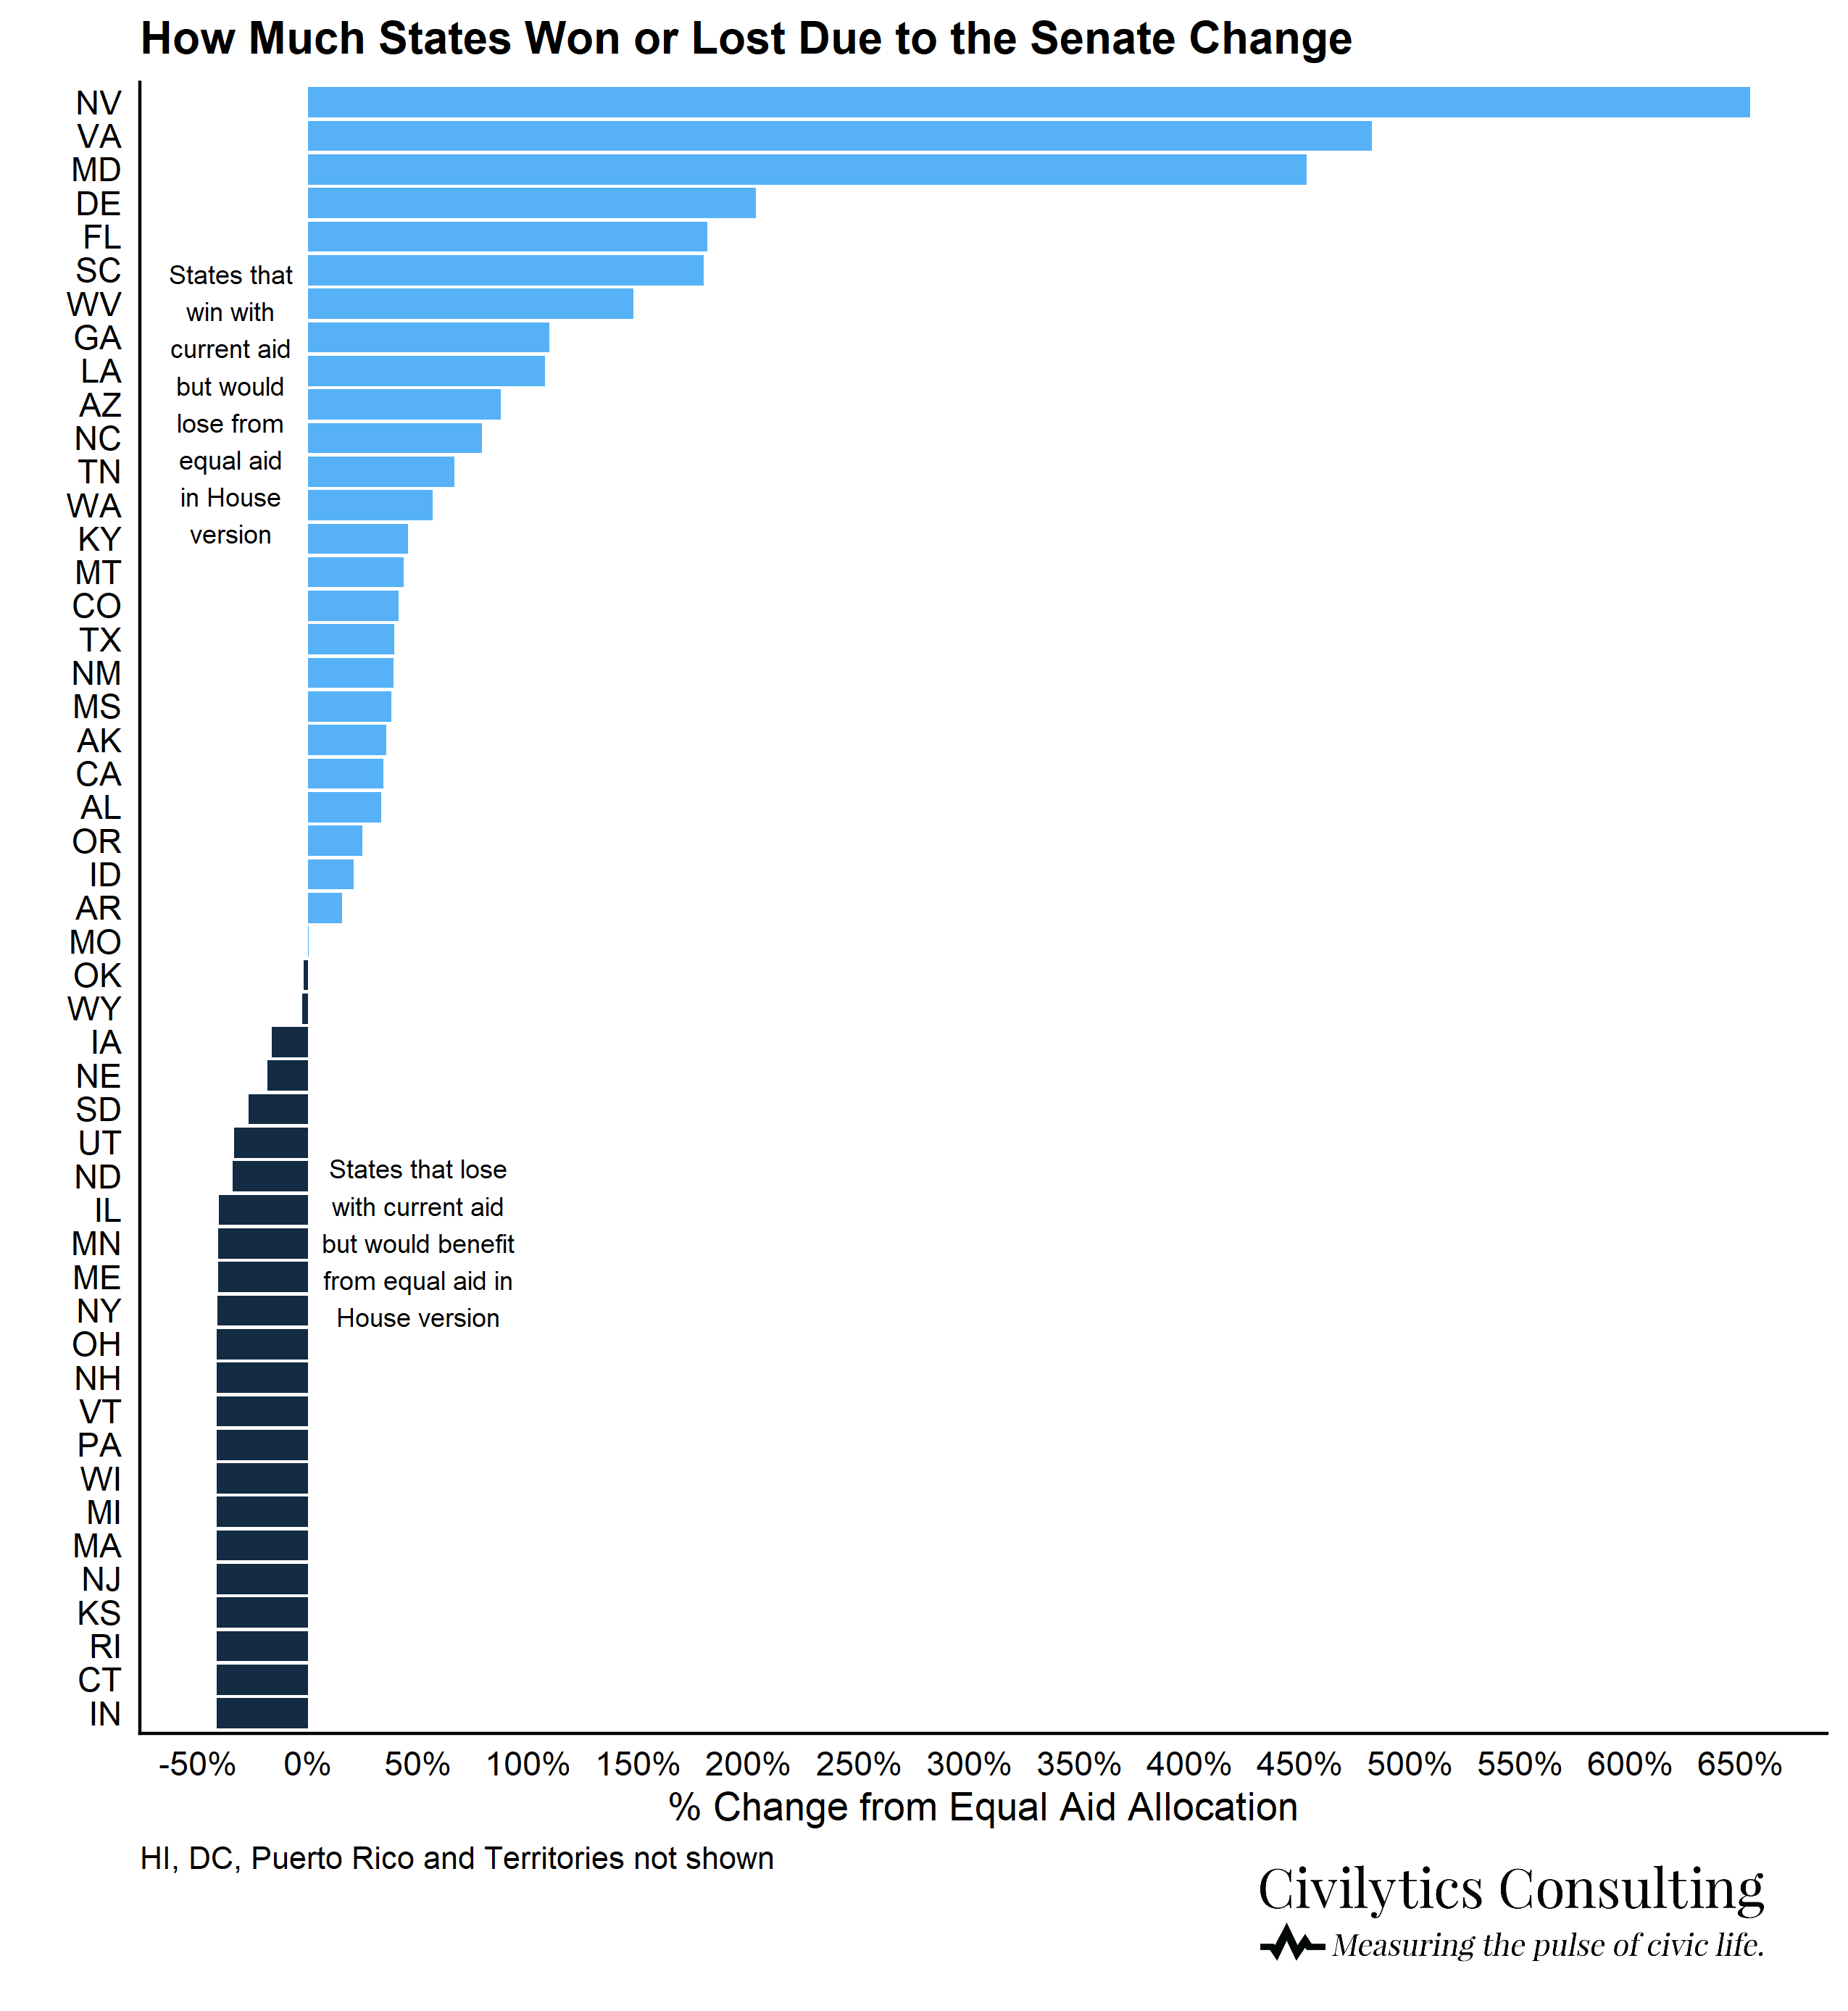
In all, more than $5 billion in funding — or 25% of the total amount for NEUs — is reallocated between the two approaches.
A huge difference in funding based on a small change in wording.
You can get a table of all the allocation changes between the two methods at the bottom of this post.
Can Anything Be Done Now?
Maybe! Treasury is seeking comment on all aspects of the Interim Final Rule until July 16. Share your comments at the official regulations.gov portal. Civilytics is planning to submit our own comments based on our work so far, which you can find here.
You can also contact your senator or representative to ask them why NEUs in some states should get 10x more per resident as those in other states. Or, alternatively, if you prefer the allocation the way it is, you can let them know you appreciate that the formula accounts for unincorporated populations when making state allocations.
Either way, we hope you’ll weigh in on how these important funds are distributed to and used by communities across the country.
If you or your organization share your thoughts, please let us know via email/tweet/etc.! We’d love to hear your thoughts on both how these funds are distributed and how they should be used locally!
How Much the Senate Change Affected NEU Aid in Every State
| State | Final Allocation, Senate (millions) | Allocation under House Formula (millions) | Allocation Change (millions) | % Change from House Version |
|---|---|---|---|---|
| AL | $356 | $267 | $89 | 33.4% |
| AK | $43 | $32 | $11 | 35.6% |
| AZ | $227 | $121 | $106 | 87.5% |
| AR | $216 | $187 | $29 | 15.7% |
| CA | $1,218 | $907 | $311 | 34.3% |
| CO | $265 | $188 | $77 | 41.1% |
| CT | $203 | $345 | -$142 | -41.3% |
| DE | $91 | $30 | $61 | 203.2% |
| FL | $1,416 | $504 | $913 | 181.3% |
| GA | $862 | $411 | $451 | 109.7% |
| ID | $108 | $89 | $19 | 20.8% |
| IL | $742 | $1,241 | -$499 | -40.2% |
| IN | $433 | $738 | -$305 | -41.4% |
| IA | $222 | $265 | -$43 | -16.3% |
| KS | $167 | $285 | -$117 | -41.2% |
| KY | $324 | $223 | $101 | 45.4% |
| LA | $315 | $152 | $164 | 107.7% |
| ME | $119 | $201 | -$82 | -40.7% |
| MD | $529 | $96 | $433 | 453.3% |
| MA | $385 | $655 | -$270 | -41.2% |
| MI | $644 | $1,096 | -$452 | -41.2% |
| MN | $377 | $635 | -$258 | -40.6% |
| MS | $268 | $194 | $74 | 38.1% |
| MO | $450 | $448 | $3 | 0.6% |
| MT | $86 | $60 | $26 | 43.4% |
| NE | $111 | $136 | -$25 | -18.1% |
| NV | $151 | $20 | $131 | 654.4% |
| NH | $112 | $191 | -$79 | -41.2% |
| NJ | $578 | $984 | -$405 | -41.2% |
| NM | $126 | $91 | $35 | 38.8% |
| NY | $774 | $1,315 | -$541 | -41.1% |
| NC | $705 | $394 | $311 | 79.0% |
| ND | $53 | $81 | -$28 | -34.1% |
| OH | $844 | $1,435 | -$591 | -41.2% |
| OK | $238 | $243 | -$5 | -1.9% |
| OR | $248 | $199 | $49 | 24.7% |
| PA | $983 | $1,672 | -$689 | -41.2% |
| RI | $58 | $99 | -$41 | -41.2% |
| SC | $435 | $156 | $279 | 179.6% |
| SD | $65 | $89 | -$24 | -27.0% |
| TN | $438 | $263 | $175 | 66.6% |
| TX | $1,386 | $996 | $390 | 39.1% |
| UT | $187 | $281 | -$94 | -33.5% |
| VT | $59 | $100 | -$41 | -41.2% |
| VA | $634 | $109 | $525 | 482.6% |
| WA | $443 | $282 | $160 | 56.8% |
| WV | $162 | $66 | $97 | 147.8% |
| WI | $412 | $700 | -$289 | -41.2% |
| WY | $48 | $49 | -$1 | -2.6% |
Revision on 6/24/2021: Our previous version of the table and third figure above had unclear labels for the percentage change. We revised to focus consistently on the percent change from the House version, that is the equal allocation approach (i.e., House estimate as denominator). The alternative using the Senate allocation as the denominator can be easily calculated from the table above and represents the hypothetical % change from the current law.
- *The range is from $161 up to $200 per resident depending on the final population of NEUs ruled eligible from Treasury’s list.