
As I mentioned in a prior post, I recently presented to a group of academic researchers on local budgets and police spending. In the presentation (and elsewhere ), I talked about 4 different way to look at and present police expenditures. Trying out each approach is important because different frames or lenses can be more powerful or resonate more with different audiences.
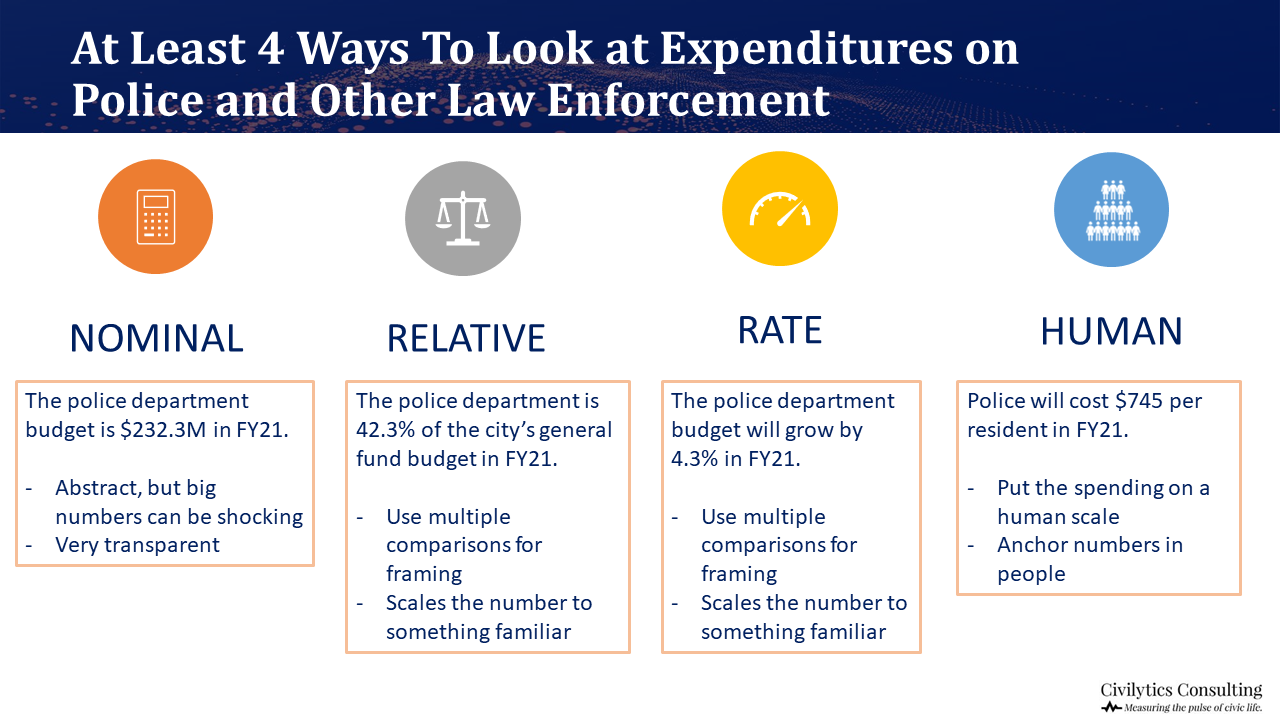
I’m going to walk through some examples of each frame and why each may be powerful in a given case.
1. Nominal
This frame can be especially helpful in cases where police spending in the budget is shockingly large. For example:
- LA County plans to spend $6.4B on “law and justice” offices with over half of this — $3.4B — going solely to the sheriff’s department in FY22.
- Miami-Dade County spends more than $1.1B a year on police and corrections ($765M on police and $384M on corrections in FY21).
- Atlanta plans to spend $317M on police, corrections, and courts in FY22. The vast majority of that, $276M, will go to police.
2. Relative
This frame can be helpful for illustrating how police budgets can choke city spending. Cities’ and counties’ general (discretionary) funds support most services except those paid for through enterprise funds (like water, sewer, garbage). But a substantial share of most general funds go to police and other law enforcement, with the percentage ranging from 25% of general fund spending in Salt Lake City to 55% of general fund spending in Stockton.
Another way of looking at relative spending: For every $1 St. Louis spends from their general fund on police, they spend less than a penny on Health and Hospitals and less than a penny on Human Services — a ratio of 100:1.
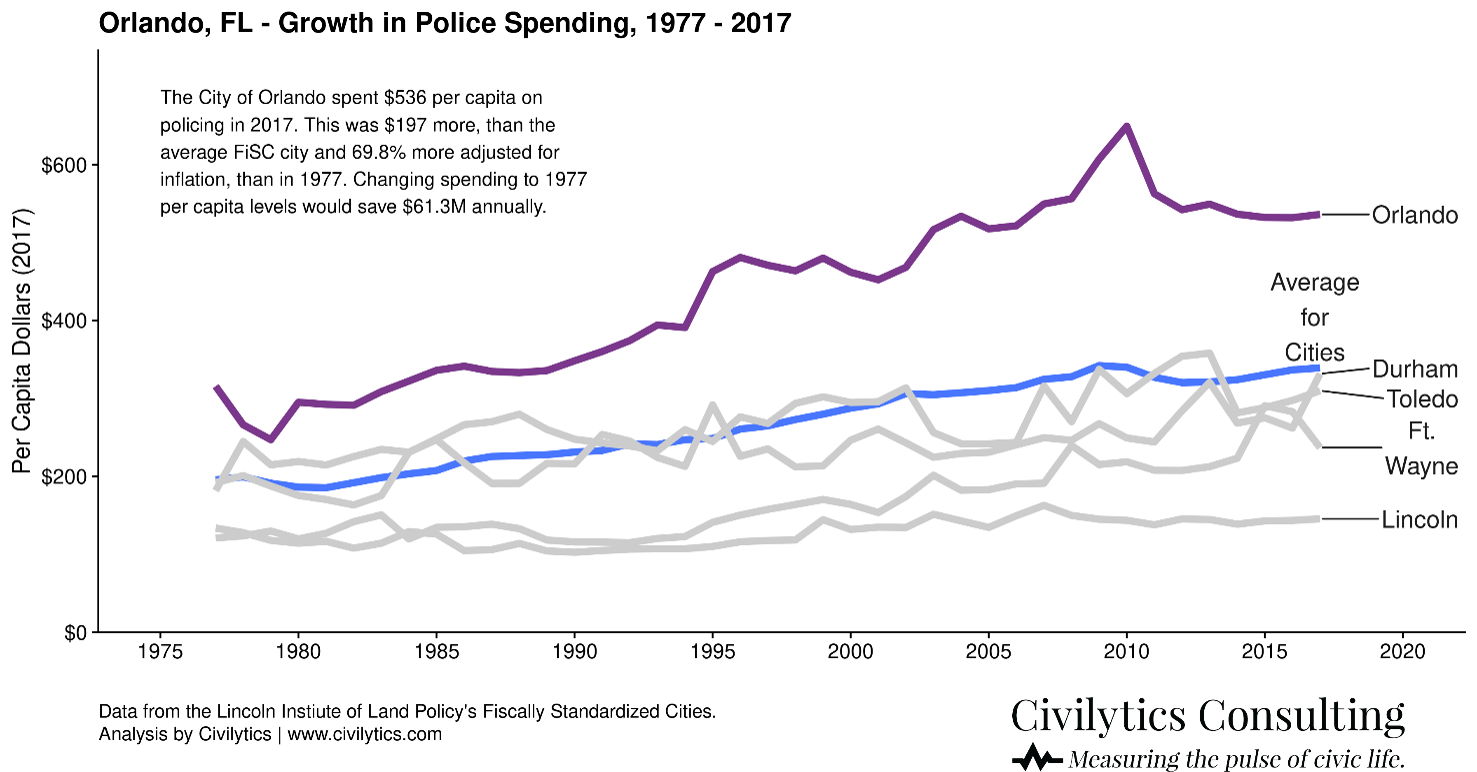
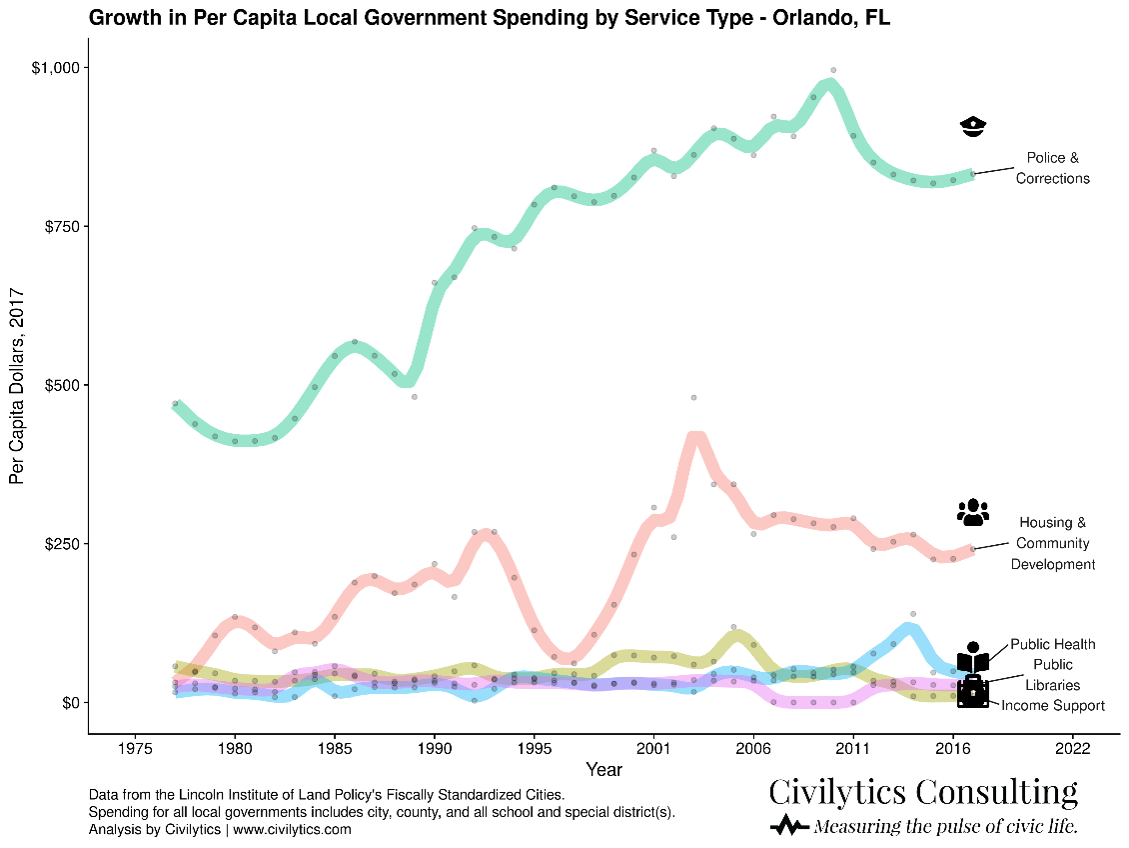
3. Rate
Showing how much the city’s spending on the police department has grown can be powerful, especially when compared to other cities (chart 1 below) or to spending on other city services (chart 2).
4. Human
Finally, the per person cost of policing can be powerful. Would you be surprised to learn that:
- DC spends $750 per resident on police each year
- Boston spends $620 per resident on police
- Nashville spends $321 per resident on police and $140 per resident on the sheriff’s office
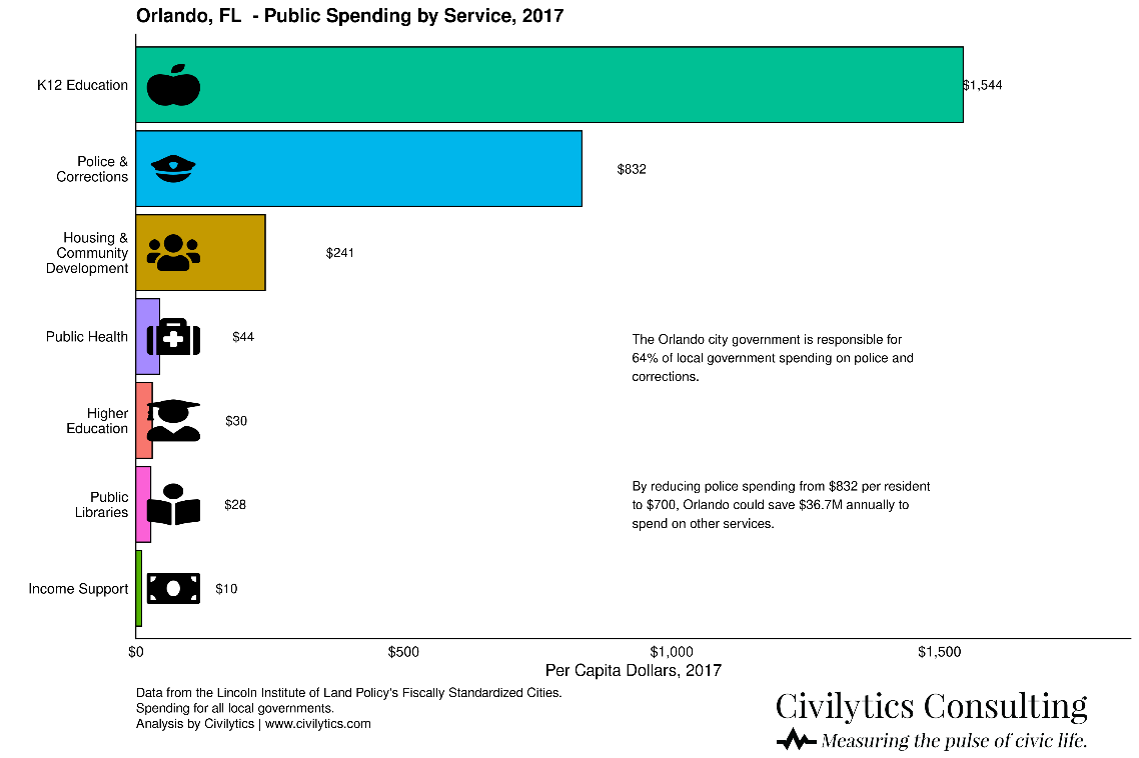
The per person cost is particularly powerful when compared to spending on other city services, as in the case of Orlando’s spending below.
So what do you think? Do you find one frame for looking at police expenditures more powerful or surprising than another?
Learn More
Civilytics has many resources to help you understand your local budget, including a prior post on 3 key items to understand about the budget and a more in-depth guide to reviewing and changing the police budget in your community.
The American Rescue Plan provides an unprecedented expansion of federal funding to support local communities, making local choices about how to spend discretionary funding more important than ever. We encourage you to get involved and let your local leaders know that people are watching the budget closely. Below are some resources to help!
- Federal aid (ARPA) resources
- Community programs to build safe and healthy communities (part 1) (part 2)