Policing the American University: Online Appendix
For additional context, online Appendix B is an online appendix giving additional tables and graphs providing more detailed disaggregation of CPD data presented in Policing the American University.
- Policing the American University: Online Appendix
UCR Coverage by Sector and Size
We can further breakdown these results by distinguishing universities by both size and whether they are public or private in the table below. Here we confirm the previous findings by BJS that public universities are more likely to have police agencies and that almost all campus police serve larger public or private non-profit institutions.
| University Type | Number of Students | Campus Count | Matched ORI | One or More Employees | One or More Arrests |
|---|---|---|---|---|---|
| Public | 20,000 and above | 191 | 142 | 138 | 123 |
| Public | 10,000–19,999 | 277 | 157 | 143 | 116 |
| Public | 5,000–9,999 | 392 | 196 | 167 | 140 |
| Public | 1,000–4,999 | 687 | 177 | 142 | 102 |
| Public | Under 1,000 | 448 | 40 | 17 | 10 |
| Private not-for-profit | 20,000 and above | 23 | 7 | 8 | 6 |
| Private not-for-profit | 10,000–19,999 | 52 | 14 | 15 | 14 |
| Private not-for-profit | 5,000–9,999 | 111 | 23 | 16 | 15 |
| Private not-for-profit | 1,000–4,999 | 723 | 81 | 58 | 37 |
| Private not-for-profit | Under 1,000 | 1,012 | 23 | 7 | |
| Private for-profit | 20,000 and above | 10 | |||
| Private for-profit | 10,000–19,999 | 8 | |||
| Private for-profit | 5,000–9,999 | 13 | |||
| Private for-profit | 1,000–4,999 | 135 | 2 | 1 | |
| Private for-profit | Under 1,000 | 2,860 | 4 | 2 |
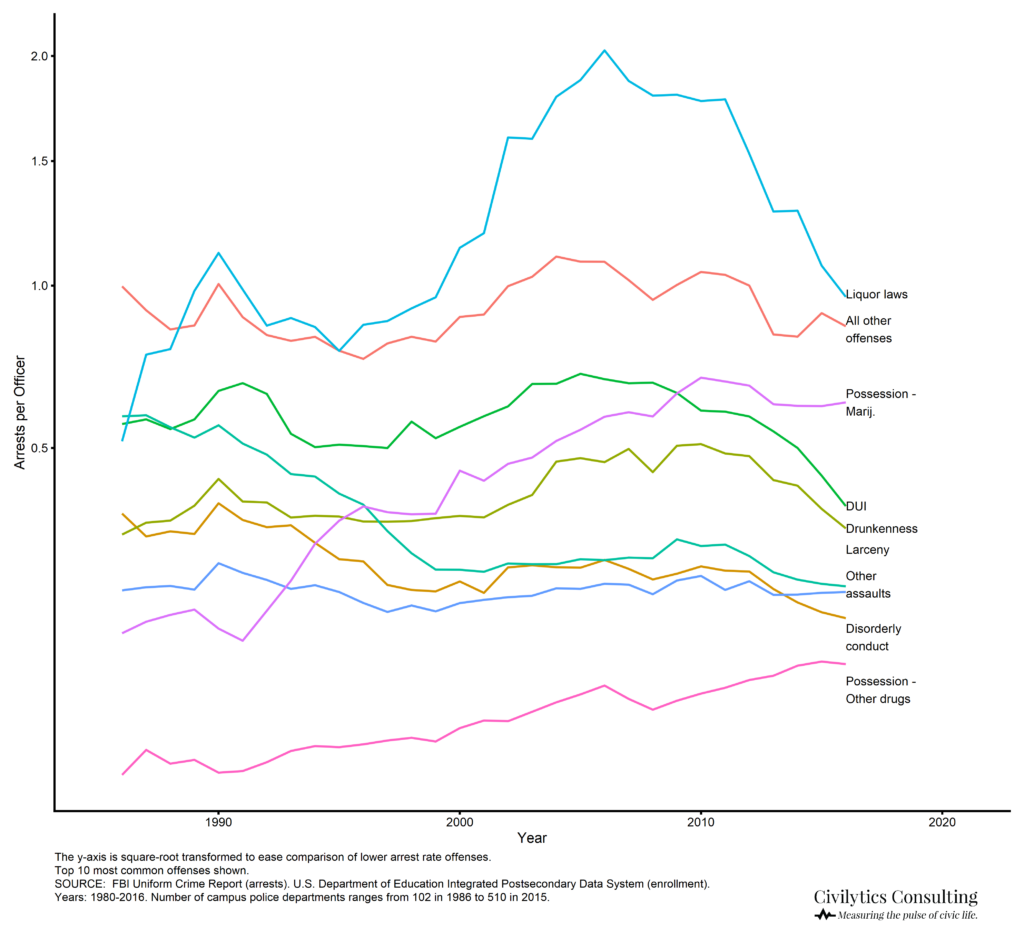
Further Analysis of Trends in Arrests per Officer
CPD Trends in Arrests per Officer by Offense
Another way to look at campus police arrest rates over time is to standardize the arrests by the number of officers being reported on. This figure shows the same patterns of growth and the same relative rankings of offenses in the overall arrest trend and the arrests per student trend. This suggests that as more campus police departments report their data to the UCR the same overall pattern of arrest volume is holding.
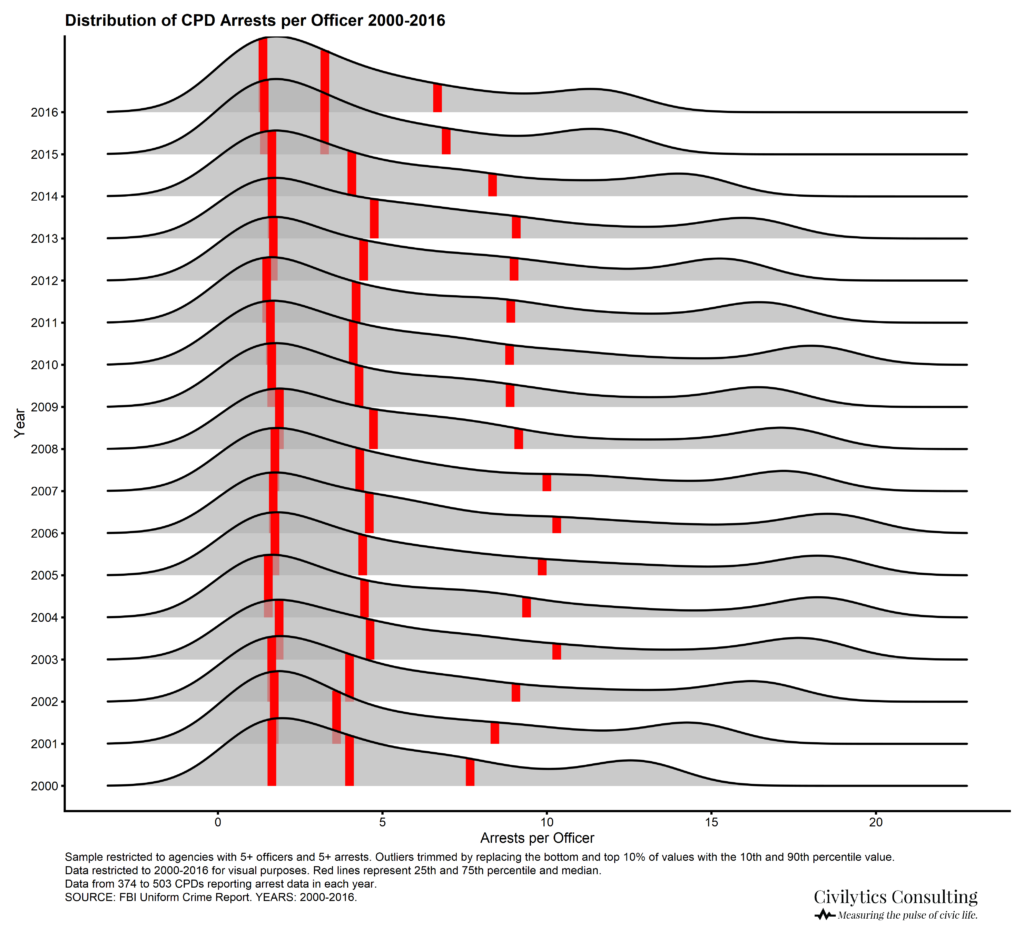
Variance in CPD Arrests per Officer over Time
This figure shows the distribution of the arrests per officer across all CPDs with at least 5 arrests and 5 officers. This figure shows that while the mean arrests per officer for all CPDs has changed over time, the distribution of arrests per officer across CPDs has remained relatively stable. The biggest change has been a dramatic reduction in the most extreme outliers of arrests per officer, highlighted by the shrinking of the 75th percentile value (far right red line). The distribution has also become less bi-modal over time.
Further Comparisons of Campus and Municipal Police
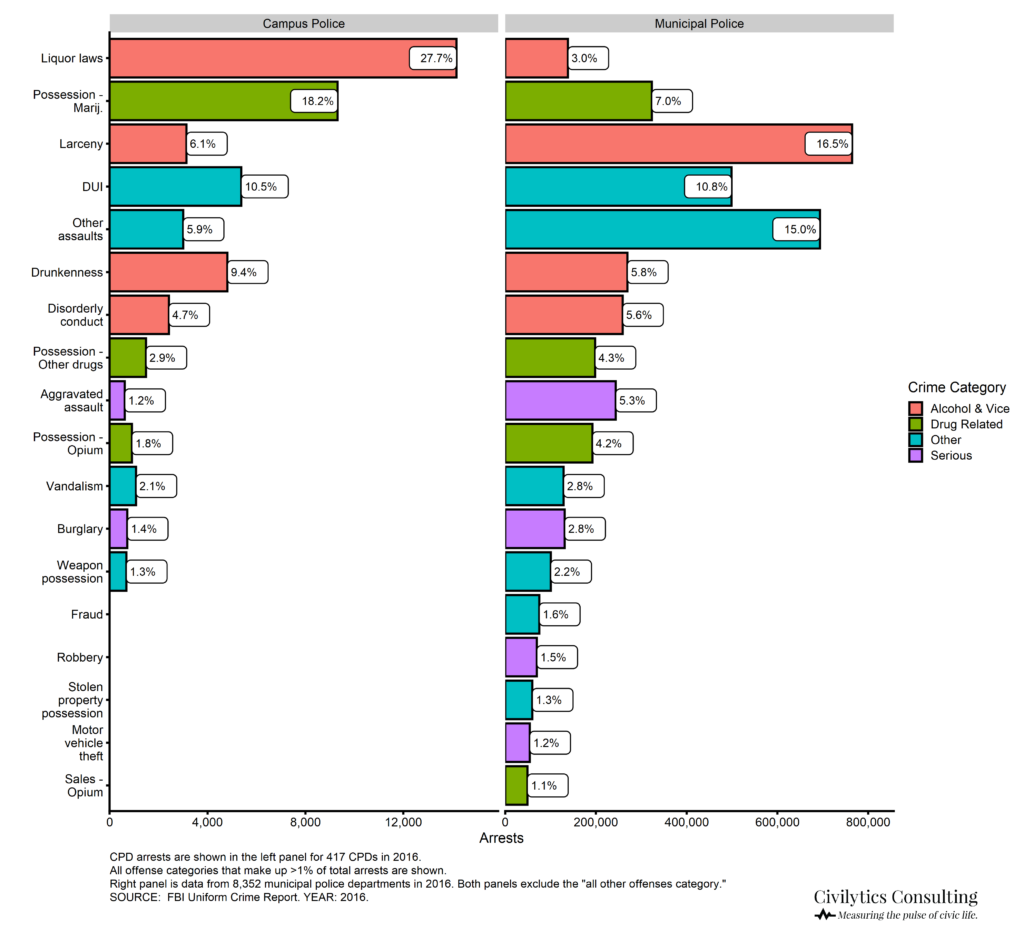
Comparing Total Arrests by Offense for Campus and Municipal Police Departments in 2016
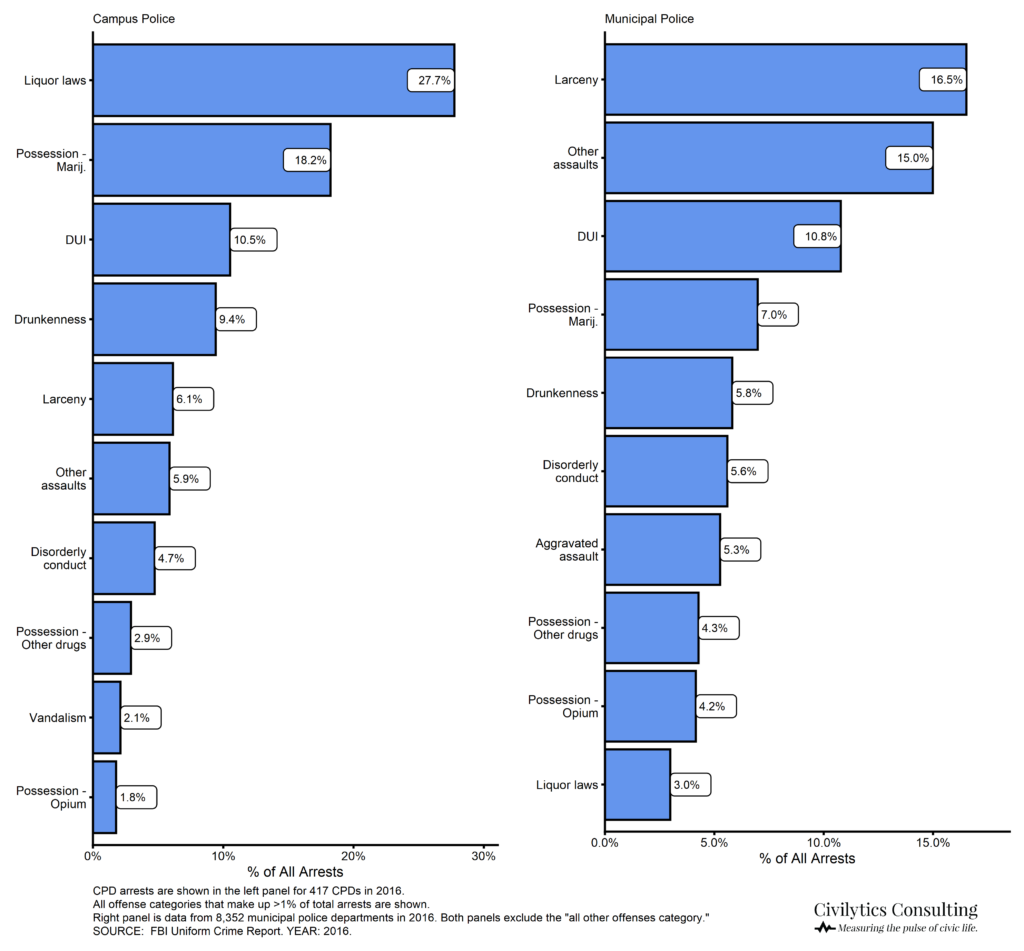
Comparing Arrest Share of Offenses in 2016 between Campus and Municipal Police Departments
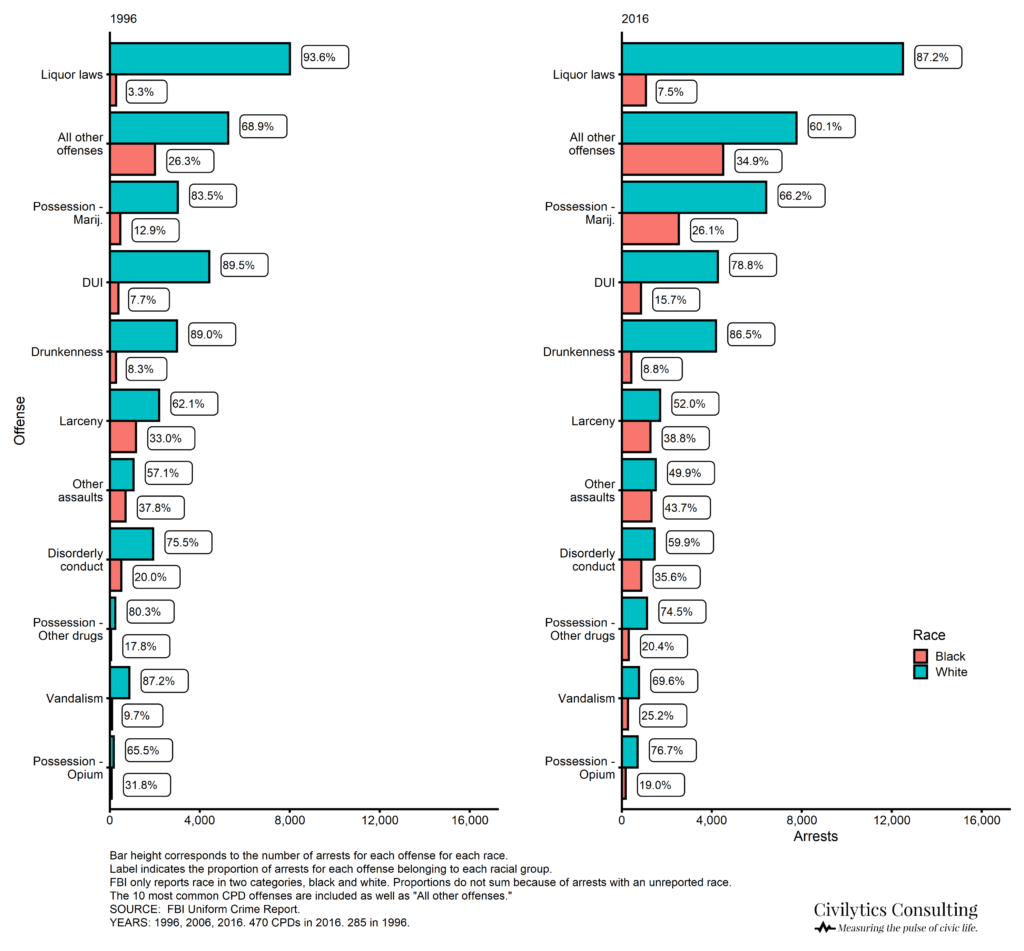
Comparing Arrest Share of Offenses by Race (Black and White) for CPDs in 1996 and 2016
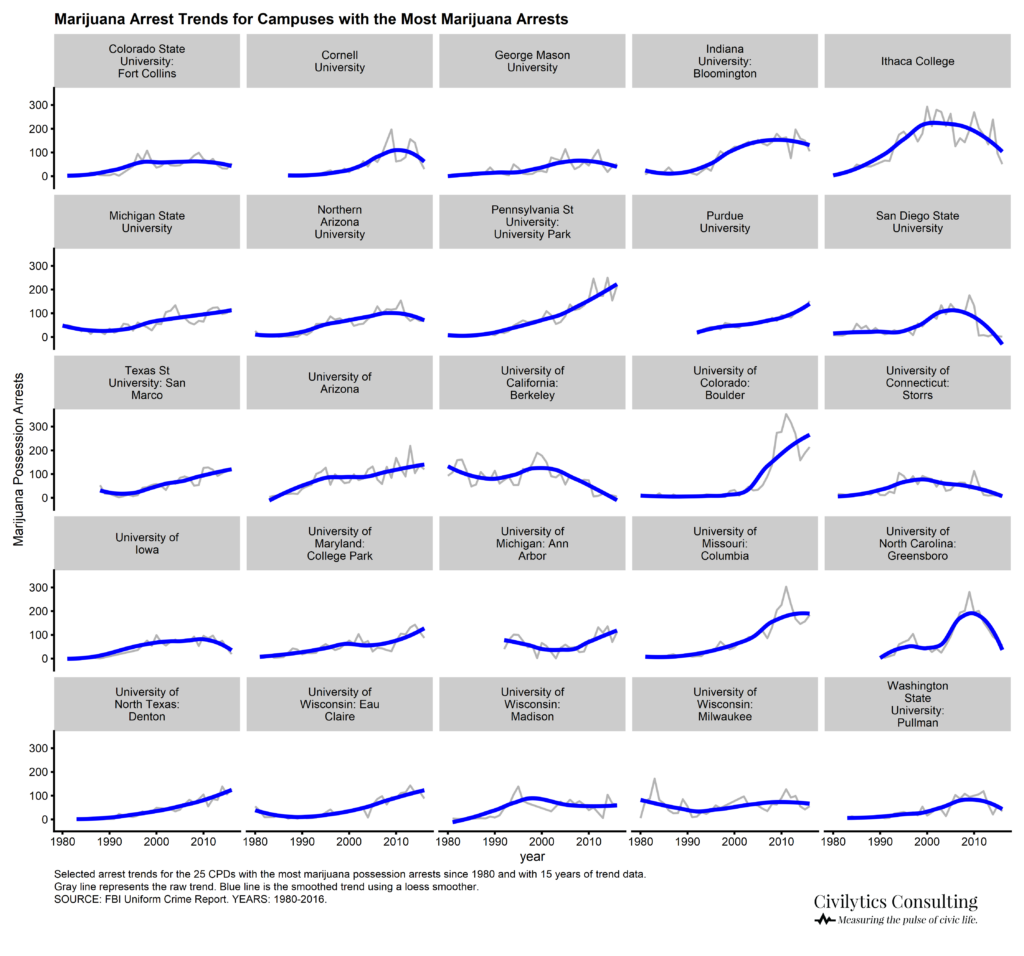
Individual Campus Arrest Trends for Marijuana
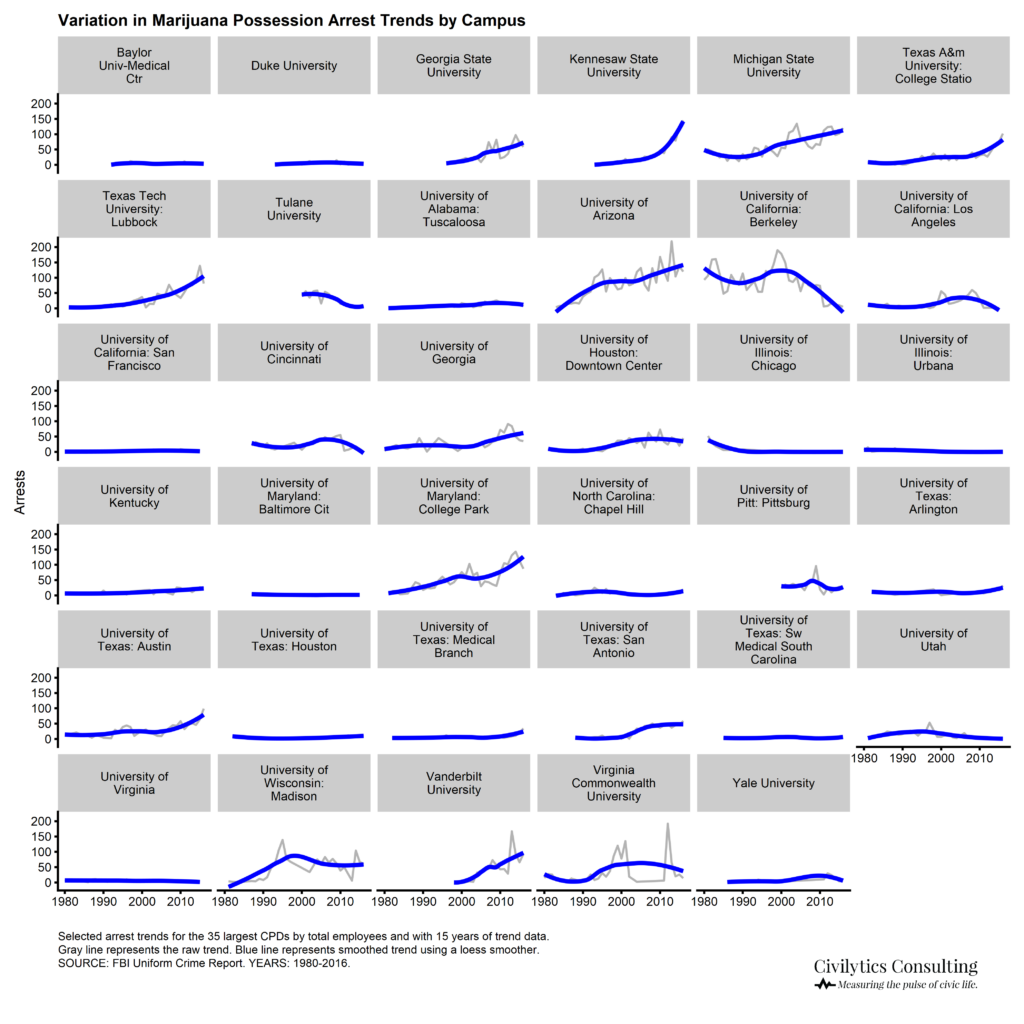
Marijuana Possession Arrest Trends for 35 Largest CPDs
Marijuana Possession Arrest Trends for 25 CPDs with Most Marijuana Possession Arrests
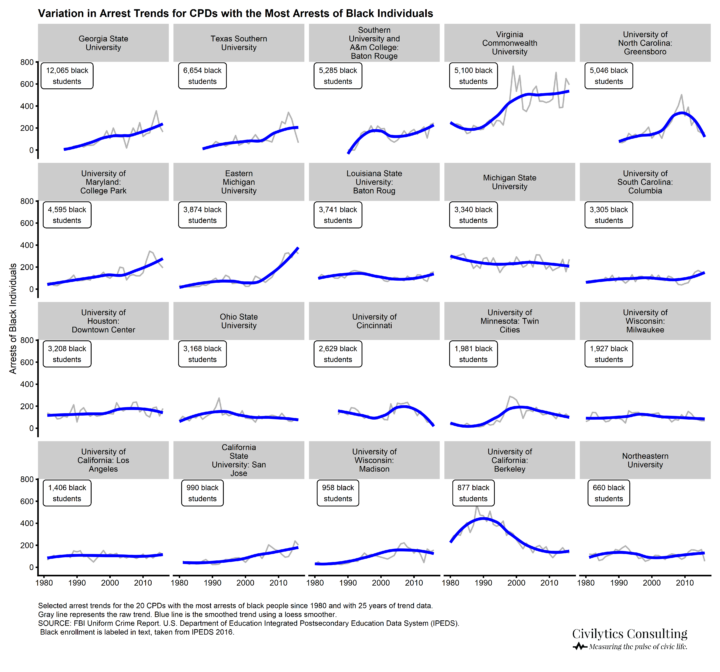
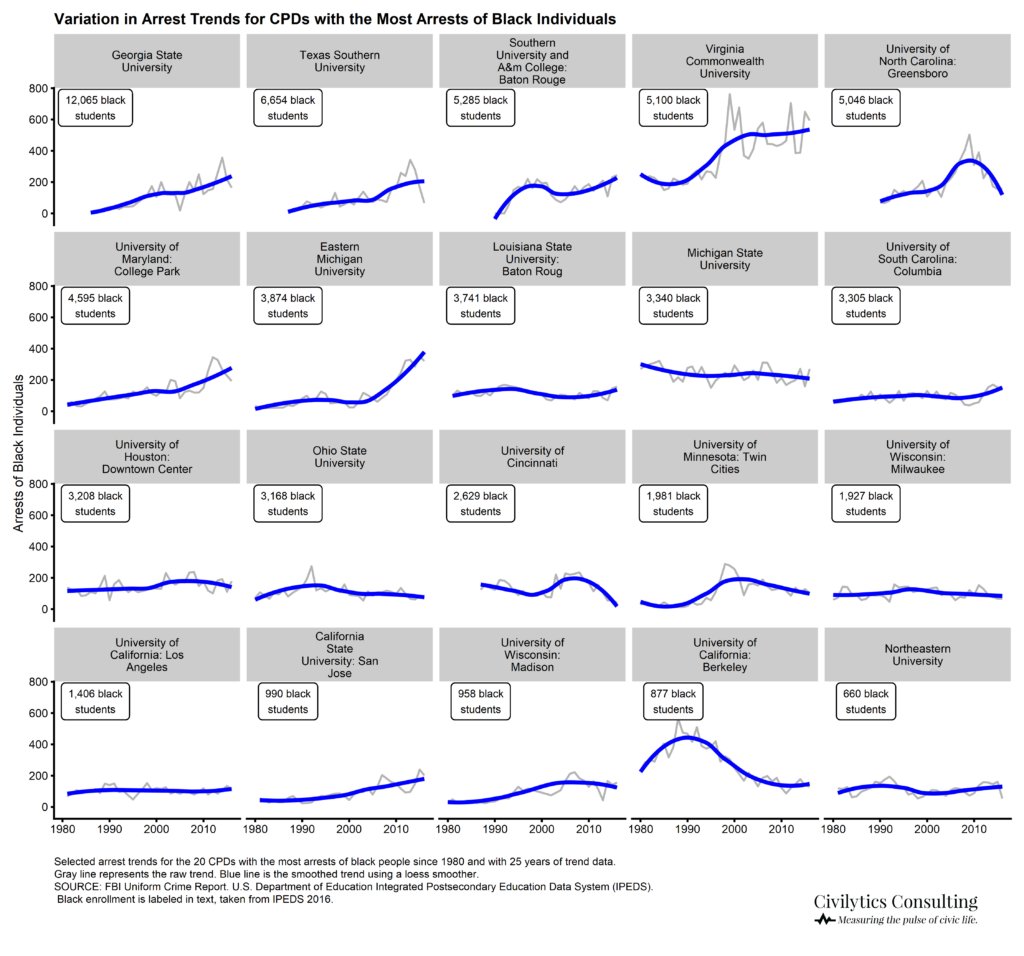
Individual Campus Arrest Trends for Arrests of Black People
Arrest Trends of Black People for 25 CPDs with Most Arrests of Black People since 1980
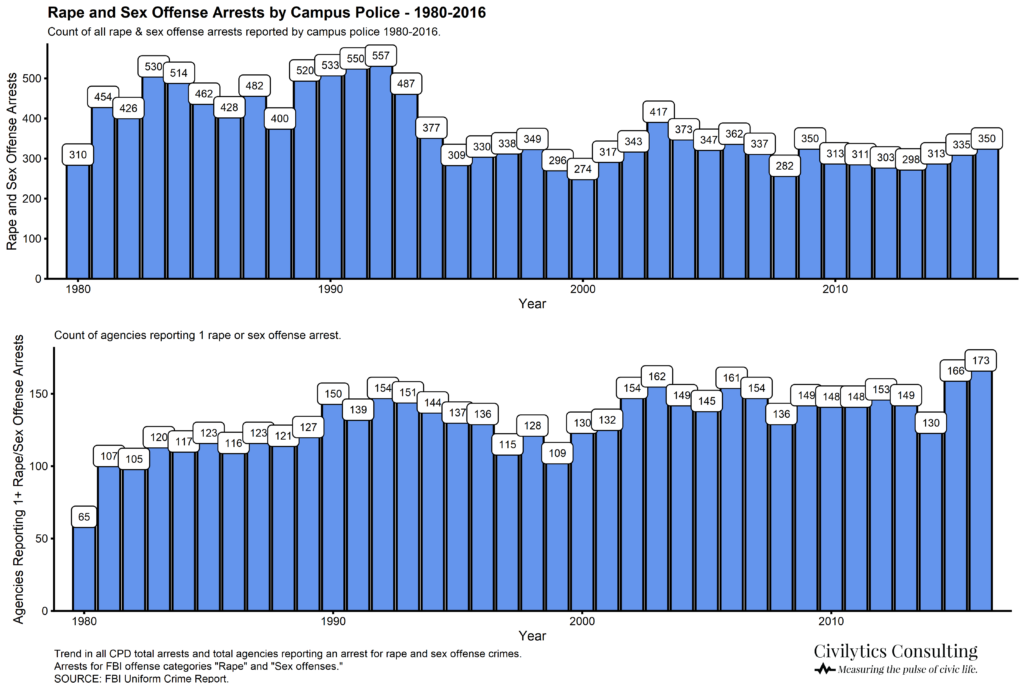
Trends in CPD Arrests for Rape and Sex Offenses
Number of CPDs Making Arrests and Total Arrests by CPDs for Rape and Sex Offenses