
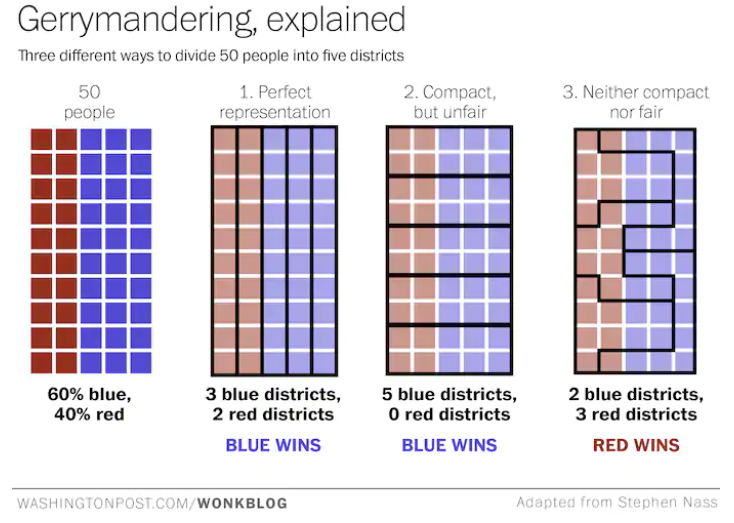
“Prison gerrymandering” isn’t a concept most people are familiar with. We hear about “regular” gerrymandering before every congressional election and after every decade’s Census. And we probably vaguely remember from school that the term “gerrymandering” was coined because the original “gerrymandered” district looked like a salamander and was drawn by a Massachusetts governor with the last name of Gerry.
But what is prison gerrymandering and why does it matter?
To answer this question, a new dashboard created for the Tableau Racial Equity Data Hub by Lovelytics and Civilytics Consulting starts with some building blocks many people already know.
Prison gerrymandering is the practice of counting prisoners where they are confined, often far from their home, for the purpose of redistricting. Using prison gerrymandering, states can draw legislative districts that distort the “one person one vote” principle by taking advantage of the location of prisons to give residents of some districts more voting power and those of other districts less.
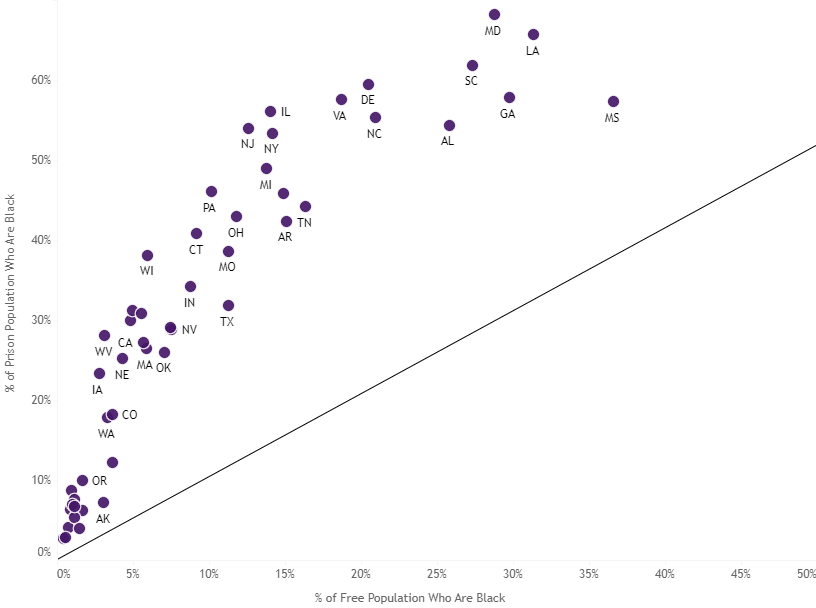
The first building block is mass incarceration and specifically racial disparities in mass incarceration. Over 2.2 million people were incarcerated in 2010. Black/African-American and American-Indian individuals were much more likely to be imprisoned than White, non-Hispanic people. For instance, in Maryland, 68% of people in prison were Black compared to only 29% of non-incarcerated Marylanders. In every state, Black/African-American people are a much greater share of the incarcerated population than the “free”* population, sometimes by a ratio of 5 to 1 or more.
How does mass incarceration connect with political representation?
Many people know that, in most states, people in prison cannot vote (Lewis 2019). Fewer realize that people in prison count toward the population of the community where they’re incarcerated, not toward the population of their home community.
Since the first U.S. Census, incarcerated people have been counted as residents of the prison, rather than at their last home address (Wang and Devarajan 2019). This affects political representation especially for the most local legislative districts.
10 states incarcerate so many people that, if incarcerated people were counted together as a single district, they would elect their own representative to the state house.
Prisons are disproportionately located in less densely populated rural areas, meaning that counting incarcerated people as residents of a prison tends to increase representation for rural communities and decrease representation for urban communities.† Because of racial segregation and disparities in mass incarceration, this can result in large disparities between the racial/ethnic makeup of incarcerated residents of a district versus free residents.
Consider states’ lower legislative houses – every state except Nebraska has one. Just as the U.S. House of Representatives has more seats than the Senate, state legislatures have more seats in their lower house, with each lower house legislator representing a smaller district and fewer constituents.
Legislators almost always focus their efforts on free constituents and very rarely think of incarcerated people as part of their district – even when incarcerated people make up 10% or more of the district (Wang and Devarajan 2019).
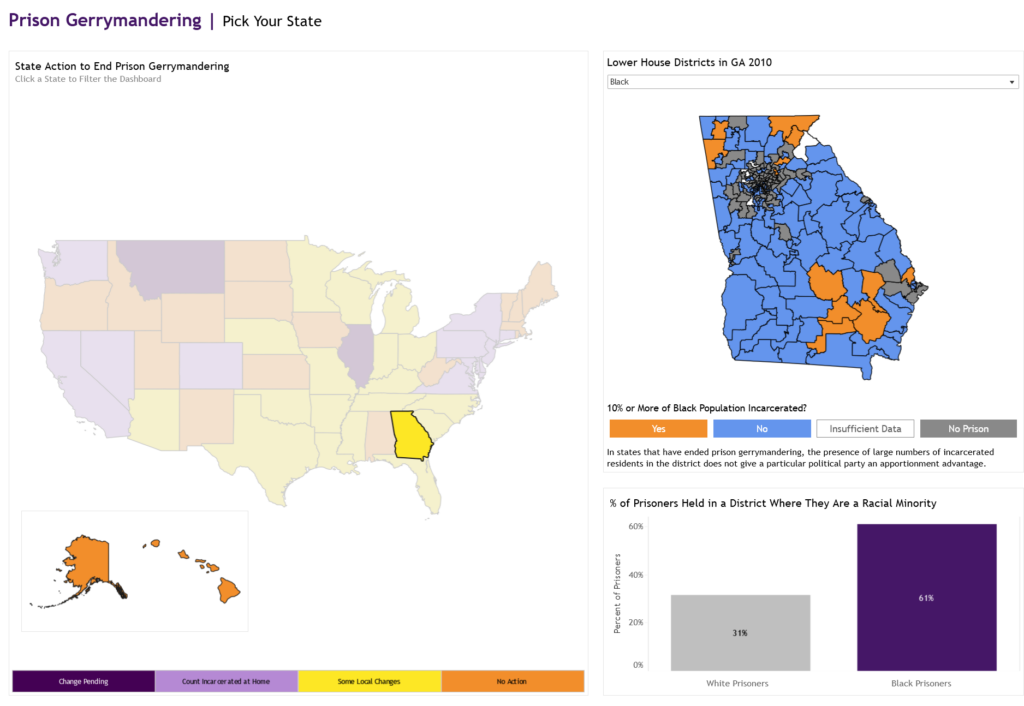
Because of prison gerrymandering, the race/ethnicity of people incarcerated in a district is often very different from that of the district’s free residents. For example, in 521 legislative districts, more than 10% of all Black people in the district are incarcerated! On the dashboard, you can explore how many districts in what states have exceptionally large disparities between the incarcerated and free population.
Some states are taking action to end prison gerrymandering
The dashboard shows that 11 states have eliminated prison gerrymandering and two have a change pending. For states that haven’t ended prison gerrymandering, users can drill down to specific legislative districts to see which have large racial disparities between free and incarcerated residents. For example, you can see which districts in a given state have over 10% of Black/African-American people in prison.
Why now?
Redistricting is underway in state legislatures across the country.‡ Decisions made in this redistricting cycle will affect political representation for the next 10 years.
By walking through how prison gerrymandering occurs — from racial disparities in mass incarceration to counting incarcerated people as residents of the prison to locating prisons predominantly in rural areas — this dashboard hopes to break down a complicated issue into clear components. The dashboard focuses on state lower-house legislative districts, but the issue affects all representative districts including county supervisors, upper-house districts, and the U.S. Congress. The smaller the district, the greater the distortion from prison gerrymandering (“Don’t Count on the Census” 2020).
States and their residents are increasingly recognizing the issue and taking steps to address it, so now is a great time to learn more about prison gerrymandering and get involved. The Prison Policy Initiative (PPI) has lots of great resources, including up-to-date information about the status of prison gerrymandering in each state and state-specific groups working to end the practice.
Learn More
We also published an in-depth discussion of how the data and analysis for this dashboard came together. Sign up for our newsletter to get monthly updates on our work and get more in-depth data analysis highlighting major issues in equity across the country.
Background on data and authors
This dashboard is based on 2010 Census data because districts haven’t yet been drawn using the 2020 data – that’s the impetus for creating the dashboard now! The dashboard was inspired by and benefited greatly from PPI’s 2015 report “The Racial Geography of Mass Incarceration.” This dashboard was created by Jared Knowles of Civilytics Consulting and Chantilly Jaggernauth of Lovelytics.
Data on incarcerated populations comes from the U.S. Census Bureau’s Group Quarters collection. These data were prepared, analyzed, and made available at the Census-block level by PPI. Census TIGER 2013 files were used for state legislative district boundaries, and 2010 Census Population data for state lower house legislative districts came from the Decennial Census SF1 Summary File. Current party membership of state legislative districts was provided by the Open States Bulk Data API. The number of seats in every state legislature were collected and recorded by Civilytics.
- *This dashboard and post use “free” to refer to everyone who is not in prison. That includes over 4 million people who are on probation, parole, or in local jails. A more precise term might be “non-incarcerated” but we use “free” to emphasize the distinction between this group and those who are in prison, potentially far from home and counting toward another community’s political representation. https://www.prisonpolicy.org/reports/pie2020.html
- †Legislators sometimes further increase prison gerrymandering by drawing district boundaries in strategic ways to maximize the advantage of having a prison located within the boundaries.
- ‡Also the number of people in prison, racial disparities in imprisonment, and the locations of prisons haven’t changed much over the past decade.
- “Don’t Count on the Census.” 2020. Reveal. February 1. https://revealnews.org/podcast/dont-count-on-the-census/.
- Lewis, Nicole. 2019. “In Just Two States, All Prisoners Can Vote. Here’s Why Few Do.” The Marshall Project. June 11. https://www.themarshallproject.org/2019/06/11/in-just-two-states-all-prisoners-can-vote-here-s-why-few-do.
- Wang, Hansi Lo, and Kumari Devarajan. 2019. “‘Your Body Being Used’: Where Prisoners Who Can’t Vote Fill Voting Districts.” Code Switch – NPR. December 31. https://www.npr.org/sections/codeswitch/2019/12/31/761932806/your-body-being-used-where-prisoners-who-can-t-vote-fill-voting-districts.