
We hope you’ve seen our new dashboard on prison gerrymandering created with Lovelytics for the Tableau Racial Equity Data Hub. If not, please check it out along with our previous post explaining why now is such an important time to understand what prison gerrymandering is and where change is happening.
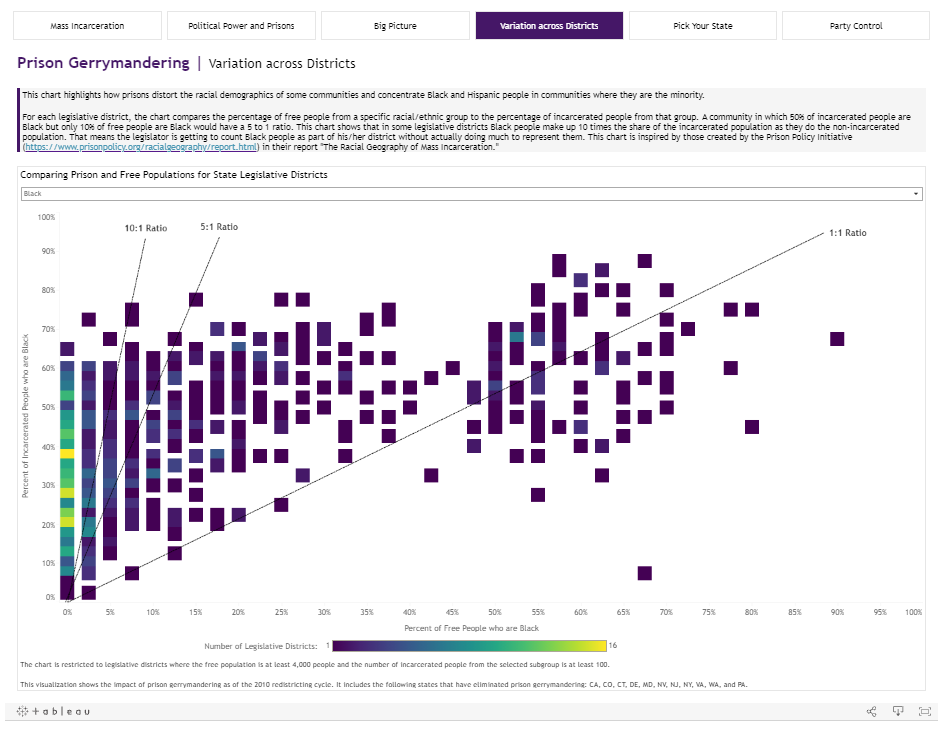
We wanted to share details of the analysis for those interested in the data and methods. As we’ve mentioned elsewhere, this analysis was inspired by and benefited greatly from Peter Wagner and Daniel Kopf’s July 2015 report, “The Racial Geography of Mass Incarceration,” published by the Prison Policy Initiative. The main difference in our analysis is the focus on legislative districts, rather than counties. Legislative districts illustrate prison gerrymandering more directly but require adding another geographic layer to the analysis.
Data Sources
Most data for this project comes directly or indirectly from the Census. We start with the Census Bureau’s Topologically Integrated Geographic Encoding and Referencing (TIGER) files. These contain geographic entity codes (GEOIDs) for many types of geographies, including upper- and lower-house state legislative districts, but do not contain demographic data. We use the 2013 TIGER files which contain the legal boundaries as of January 1, 2013, which is long enough after the 2010 Census for all states to have completed the redistricting process and drawn their legislative boundaries for the 2011-2021 decade.
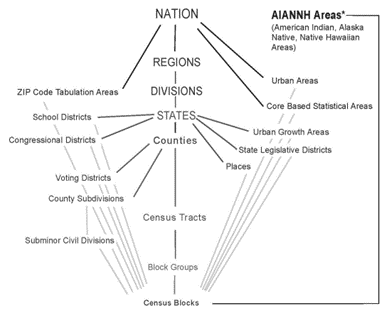
For the population of each state legislative district, including residents’ race/ethnicity, we get the 2010 Census Summary File 1 (SF1) block file, which contains population data for each census tract, block, county, etc., using the “get_decennial” function in the tidycensus package in R. The state legislative districts included in this file are from the 2006 election cycle boundaries since this file is prepared in part to aid in the redistricting process. Therefore, this file must be matched to the geography file at the block, not legislative district, level. As the graphic below shows, Census blocks are the smallest level of data collection and form the basis for all larger aggregations of Census data, including state legislative districts.
Next, data on the number of people incarcerated and their race/ethnicity comes from PPI, who have prepared, analyzed and made available data from the U.S. Census Bureau’s 2010 Group Quarters collection at the block level. According to PPI, the Census Bureau does not directly publish counts of people in “group quarters” by facility type (e.g., “correctional facilities” for adults vs. student housing) or by race/ethnicity.* Therefore, we thank PPI for the hard work of preparing these files and especially for making them publicly available. The files include state legislative district boundaries but they are again prior to the 2010 redistricting so we again need to match using Census blocks.†
The Census defines group quarters as “places where people live or stay in a group living arrangement that are owned or managed by entities or organizations providing housing and/or services for the residents.” Group quarters include prisons, military barracks, college student housing, residential treatments, nursing facilities, and more.
The last data source that we link to the legislative districts is the Open States Bulk Data API, which reports what political party represents each district. Current party membership was as June 28, 2021 (the data we accessed it). The Open States district number was used to match up with the number in the US Census boundary files.
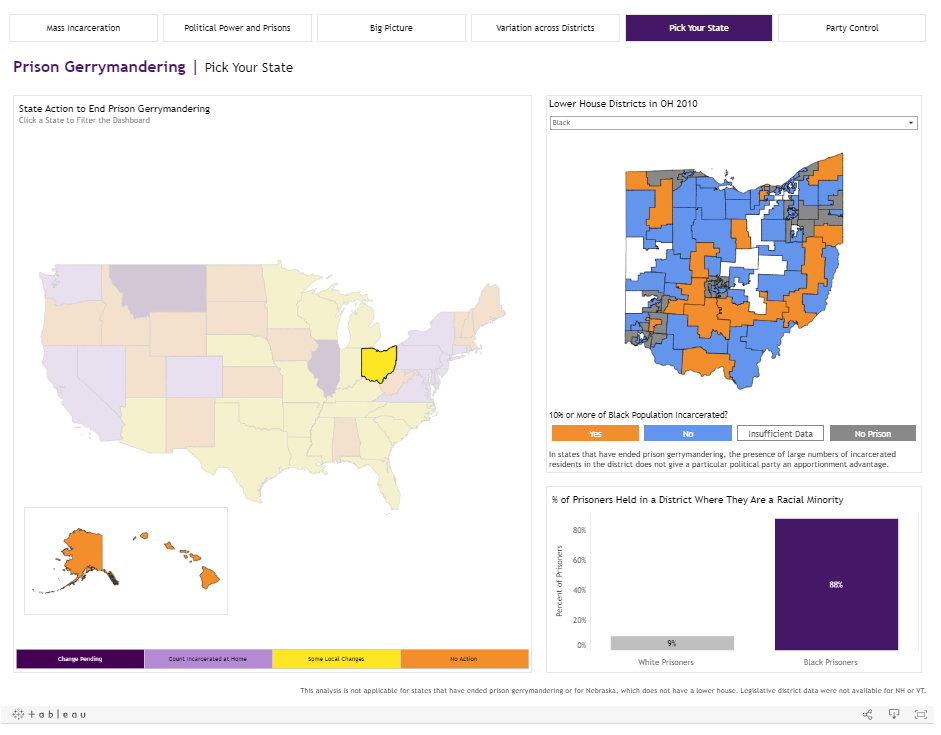
The final data source, which is at the state- not district-level, is information about which states have taken action to end prison gerrymandering. The 11 states in light purple are those that PPI reports have ended prison gerrymandering for this redistricting cycle. The states in dark purple are Montana, which PPI reports is very close to ending prison gerrymandering, and Illinois, which has ended prison gerrymandering for the 2030 redistricting cycle. States in orange are those where some jurisdictions but not the state itself have taken steps to address prison gerrymandering, according to PPI.
| Spatial matching is key to this analysis. Details on matching for those interested… |
| First, we took the 2013 boundaries for the approximately 4,700 state legislative districts and aligned them with the over 11 million Census block records (from 2010) that were used to draw them. Luckily Census blocks are not bisected by legislative district boundaries so we are able to do a spatial join that assigns blocks to the legislative district they fall within. In practice, because of differing resolution in the geographic boundaries, we found it most accurate to match using an overlap spatial join, assigning the block to the legislative district it overlapped with most. (On a reasonably powerful desktop computer this calculation took about 4 hours to complete.) From there, we repeated the matching process, again using an overlap algorithm, to aggregate the PPI block file containing group quarter counts, joined to the PPI race/ethnicity detail file for counts by race/ethnicity, to the legislative district boundary using the same process. This resulted in a file with the 2013 finalized legislative boundaries and the complete 2010 Census demographic and group quarters population data integrated for analysis. All of this work is necessary because, as PPI notes, the Census does not directly publish block level (or legislative district level) data on the type of group quarters (e.g., college vs. prison) or the race/ethnicity of the people held in group quarters. The talented team at PPI have spent countless hours reconciling different sources to make an accurate count of block-level incarceration by race/ethnicity available to the public. |
Potential Data Issues or Errors
In this case, the main potential source of error comes from properly locating the 2010 blocks into their legislative districts. Spatial merging should, in theory, be perfect, but in practice differing resolutions and irregularities in the source shape files can lead blocks to be misplaced. We discuss above how we address this issue and the small number of (possibly erroneous) legislative districts we excluded. PPI has meticulously published the race/ethnicity of correctional populations (incarcerated populations) in each block, including their sources and methodology. If you are interested in examining a particular location in more detail, we recommend you view the data details on PPI’s website.
Data on the political party control of legislative districts was obtained through the diligent work of the OpenStates project. Due to inconsistent identifiers used in the TIGER/Line files, not all legislative districts were able to be matched with the OpenStates data. Future work could reconcile these unmatched districts manually, but, for now, where no party control is shown on Tab 6, it is due to the limitations of the original TIGER file identifiers.
Analyses
As Jared often discusses, data preparation is usually the most essential part (and 90%) of the work. After completing the data acquisition and preparation described above, most of the analyses shown on the dashboard are pretty straightforward. We do want to share some analysis notes though, especially to highlight sample restrictions where applicable.
First, the dashboard often uses the following categories: Black, Hispanic, White. These represent people who, according to the Census, identified as: Black alone; Hispanic; White alone, non-Hispanic. That means the Black and Hispanic categories are not mutually exclusive. It also means people who identify as two or more races are included in any counts of the total population (e.g., for the denominator when calculating the share of the free population who are Black) but are not included in either the Black or White category.‡
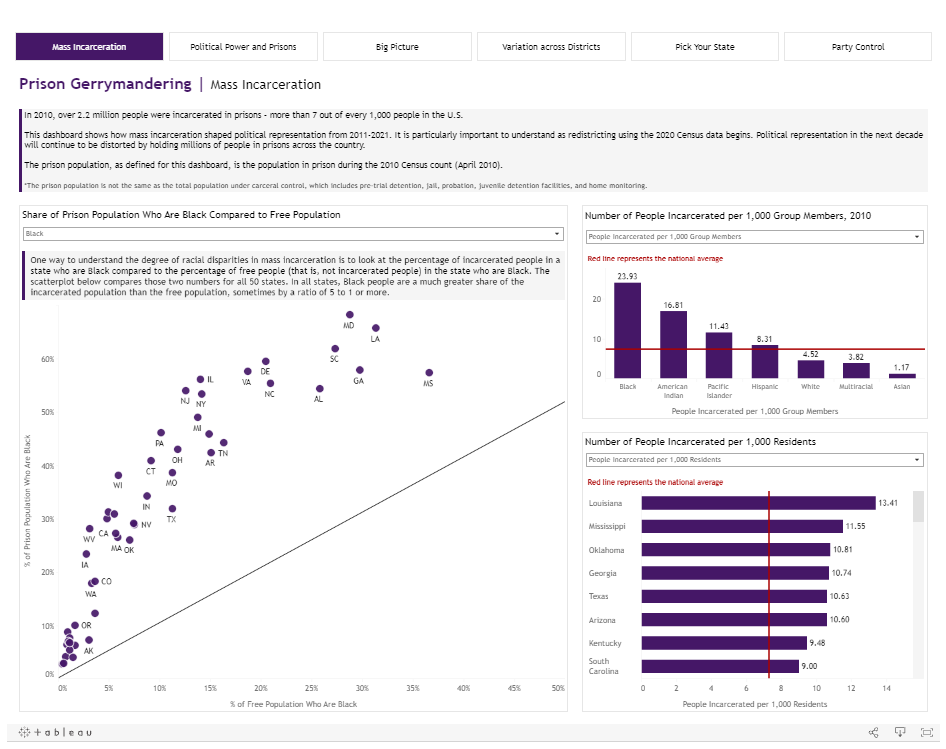
The first tab, Mass Incarceration, shows the share of the prison population who is Black (or Hispanic, depending on which category is selected) compared to the share of the free (non-incarcerated) population from that group. The “free” population is not given by the Census – we calculate it by subtracting the population in “correctional facilities” from the total population.§ The remaining calculations on this tab are straightforward (e.g., calculating incarceration rates per 1,000 members of a racial/ethnic group).
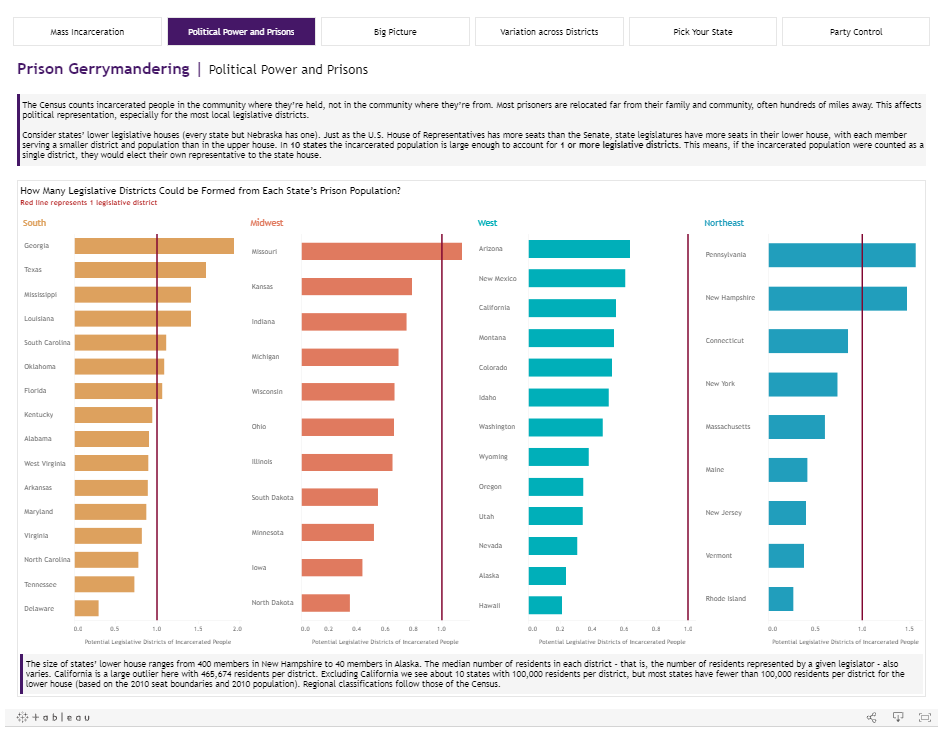
The second tab, Political Power and Prisons, introduces our first exclusion rule. The tab focuses on states’ lower-house legislative districts so Nebraska with its unicameral legislature is excluded. The tab requires a variety of calculations, including (1) the number of lower-house legislative districts per state, identified by Civilytics from the website of each state’s legislature;¶ (2) the average number of residents per lower-house district in each state, calculated by taking the total population and dividing it by the number of seats; and (3) the number of districts that could be formed from people in prison, calculated by summing each state’s population in “correctional facilities” and then dividing by the state’s average district population size above. On the tab, states are grouped into the four Census regions.
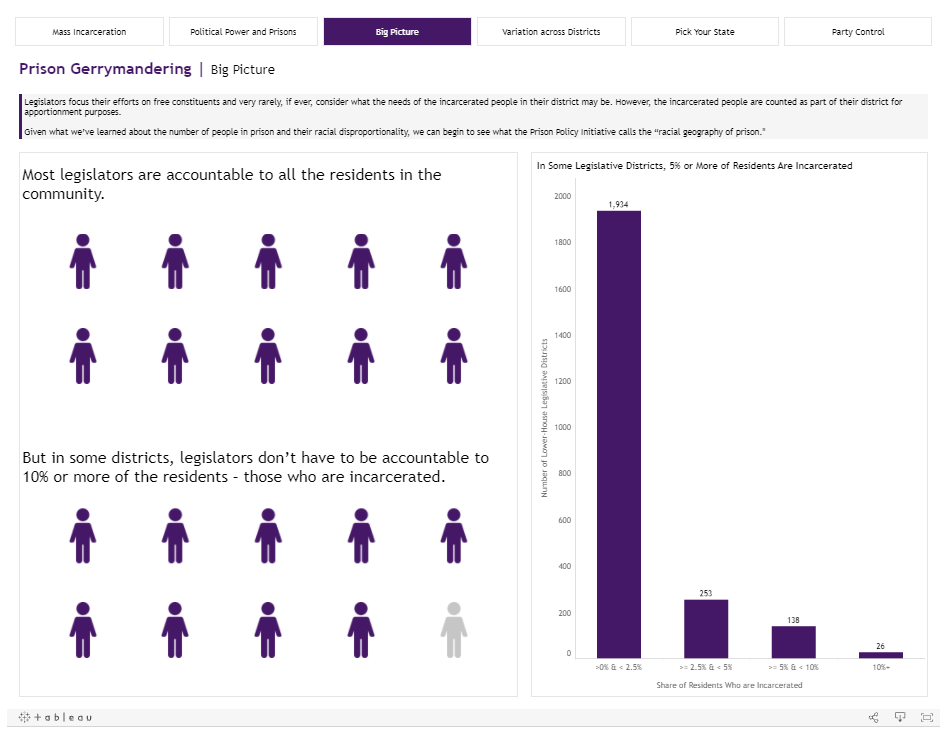
The third tab, Big Picture, shows how many legislative districts have a certain share of residents incarcerated (e.g., at least 10% of residents). This is calculated simply by dividing the number of people incarcerated in the district by the total population of the district. Because most districts do not have a prison (and, thus, do not have people counted as imprisoned within them), the chart focuses on districts that have at least some residents who are incarcerated.
On the fourth tab, Variation across Districts, a few sample size restrictions are added to help ensure that conclusions aren’t drawn based on very small numbers of people. Specifically, the chart is restricted to legislative districts where the free (non-incarcerated) population is at least 4,000 and the number of incarcerated people from the selected subgroup (Black; White, non-Hispanic; Hispanic) is at least 100. The second restriction is based on the approach used by the 2015 PPI report on which this analysis is modeled.
On the fifth tab, Pick Your State, the state-specific information on the right-side of the tab is not available for NE, which is again excluded because of its unicameral legislature, or for NH and VT because of misalignment with their legislative district data shape files (as mentioned above). Data are shown for some states that have ended prison gerrymandering but it’s important to remember for those states that the presence of large numbers of incarcerated residents in a district, while troubling, does not give a particular political party an apportionment advantage going forward. Legislative districts with 0 people incarcerated are shown in gray and labeled as “no prison” while those with fewer than 5 people incarcerated from the selected race/ethnicity and/or fewer than 50 non-incarcerated people from that race/ethnicity are shown in white and labeled as “insufficient data.”
For the bar chart in the lower right, incarcerated residents are coded as being in the racial minority if their selected race/ethnicity is less than 50% of the total population (including incarcerated individuals).
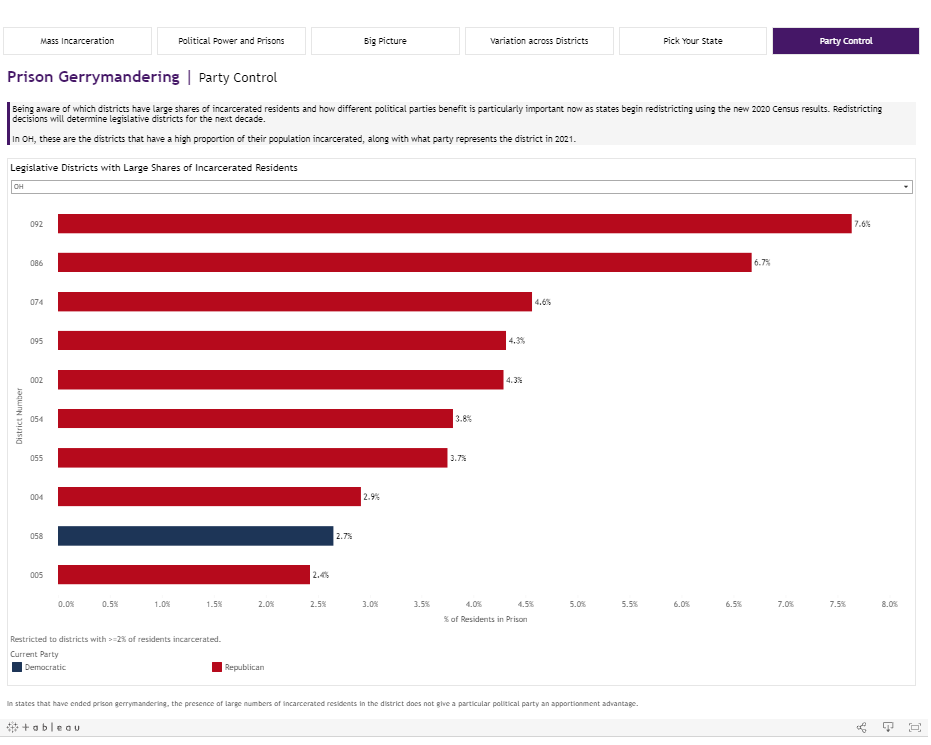
Finally, the sixth tab, Party Control, shows what political party represented districts in 2021. The graph is restricted to district where at least 2% of residents are incarcerated. NE is excluded due to its unicameral legislature. For a few states (MA, NH, VT), party affiliation of the current legislators from Open States was not able to be matched to the district names in the Census files and so is not shown.#
Additional Thoughts: Why Publish This Post?
We think it’s important to make analyses and the data preparation behind those analyses as open, public, and reproducible as possible. That means publishing the statistical scripting on git or other platforms when possible. It also means explaining the process in plain language so that someone who doesn’t read a specific type of code (R in this case) can still understand what was done and approximately how they might reproduce the work in a different programming language (something akin to literate programming).
Unfortunately this adds more work – as we discussed in this post about why we were the only fools who sunk unpaid time into understanding and documenting inequities in the ARPA funding for smaller cities and towns. But, when we can put forth the time to do this, we want to because we believe it’s critical to advancing transparent work on important issues facing the public.
We hope to see more groups and companies discussing why this matters and taking this approach.
- *We only include what PPI classifies as “institutionalized adult, correctional.” This excludes juvenile facilities and non-institutionalized forms of incarceration (e.g., home monitoring).
- †We dropped 6 legislative districts that had no proper name in the TIGER files and were matched with 0 Census blocks. In two states there were Census blocks that had no overlap with a legislative district, but this resulted in only 1 incarcerated person being excluded from the analysis.
- ‡Race/ethnicity itself is complicated, and so is working with the race/ethnicity data in the Census. We would like to contribute to more clearly specifying what decisions we made in using the race/ethnicity categories and what limitations result.
- §We use the adult incarcerated population because prison gerrymandering is affecting this group the most. However we use the total population of the district because legislative districts are drawn proportional to the whole population, not the voting age population.
- ¶For states with multi-member districts – that is multiple representatives elected for the same physical boundary (i.e., AZ, NH, NJ, SD, WA) – we included the number of people per representative, not per legislative district. For more information about states with multi-member districts, see https://ballotpedia.org/State_legislative_chambers_that_use_multi-member_districts.
- #Party ID was also missing for 1 district in WI, 1 in OH, 1 in MI, 1 in ME, 1 in MD, 1 in LA, and 2 in AL.