
Part 2 is out now showing the impact of the Senate amendment on allocations between states.
Update (6/29/2021): We’ve published our full methodology in part 3 including how you can recreate this analysis using official data sources and why it took so long to discover the problem.
Treasury recently released aid estimates for all non-county, non-metropolitan city governments, so-called “non-entitlement units.”* When we originally published our aid estimates for these 20,000+ local governments, we assumed the $19.53 billion allocated to this group would be divided up evenly among the “non-entitlement units” on a per capita basis. This was incorrect.
We set about identifying why we were incorrect, and found that the reason for the discrepancy highlights a major distinction with wide-reaching consequences for the amount of aid received by thousands of local governments.
Treasury divided this $19.53B evenly among states based on their non-metropolitan population, as directed by the legislation. But the aid only goes to “non-entitlement units.” In many states, a substantial share of the population lives in unincorporated areas so “non-metro population” ≠ “non-entitlement population” in many states.
The seemingly small decision about how to count the population this aid is targeted toward has a big impact on how much aid towns across the country will ultimately receive.
The gap results in some local governments receiving 13x as much aid per resident as others.
How do you count the non-metro population?
Treasury’s method, which we’ll call the subtractive method, takes the state population and subtracts the population of cities eligible for separate metro aid. In other words, Treasury’s method divides each state’s population into city and non-city populations and distributes the “non-entitlement unit” (NEU) aid proportional to the state’s share of the national non-city population.
However, in most states, there are 3 distinct populations: people living in metro cities, people living in small cities or towns eligible for aid (NEUs), and people living in unincorporated areas. This pot of ARPA aid is targeted at small local governments (NEUs), putting to the side unincorporated places without a local government. So an additive method of calculating the population eligible for this aid would sum up the population living in incorporated areas and exclude those living in unincorporated areas (which aren’t receiving funds). We used this additive method in our early aid estimates.
The subtractive method ignores the 24% of the US population living in unincorporated areas.
The bigger the difference between the population living in unincorporated areas and “small” (i.e., non-metro) incorporated areas, the more the subtractive method leads to distortions in funding.
Why does the method of counting people matter?
The Treasury allocates aid to states based on their non-metro population, but states will allocate aid to local governments based on the population living in each government’s jurisdiction. Unincorporated populations are counted in the state’s allocation, but are not counted when states allocate the money to localities. This means that local governments in states with a large unincorporated population will receive a much higher per capita funding amount than local governments in states with no unincorporated population.
Because the formula for state funding counts the population one way and the formula for towns counts it another, distortions emerge at the state and local level. To begin to see how this works, let’s look how the U.S., populations is distributed among metropolitan cities, other incorporated places (NEUs), and unincorporated places.
| Total | Metro City | Small Town | Unincorporated | |
| U.S. Population | 331,102,660 | 144,220,328 | 108,622,690 | 78,259,642 |
| % | 100% | 43.5% | 32.8% | 23.6% |
Nationally around one-quarter of the population lives in unincorporated areas. But this is an estimate because determining the scope and powers of a local government — and whether there is one — is technically difficult due to state variation in the definitions of and relationships among local governments and the lack of federal data on this topic.†
Treasury partially addresses this issue by providing 2 different methods for counting local governments in some states. One method, the more expansive approach, treats “minor civil divisions” or MCDs, which are weaker local governments, as NEUs. The “stricter” or narrower approach omits MCDs, focusing on stronger local governments. The two approaches result in a range of estimates for the share of the population living in small towns/NEUs versus unincorporated areas. The table above uses the average from the two methods.
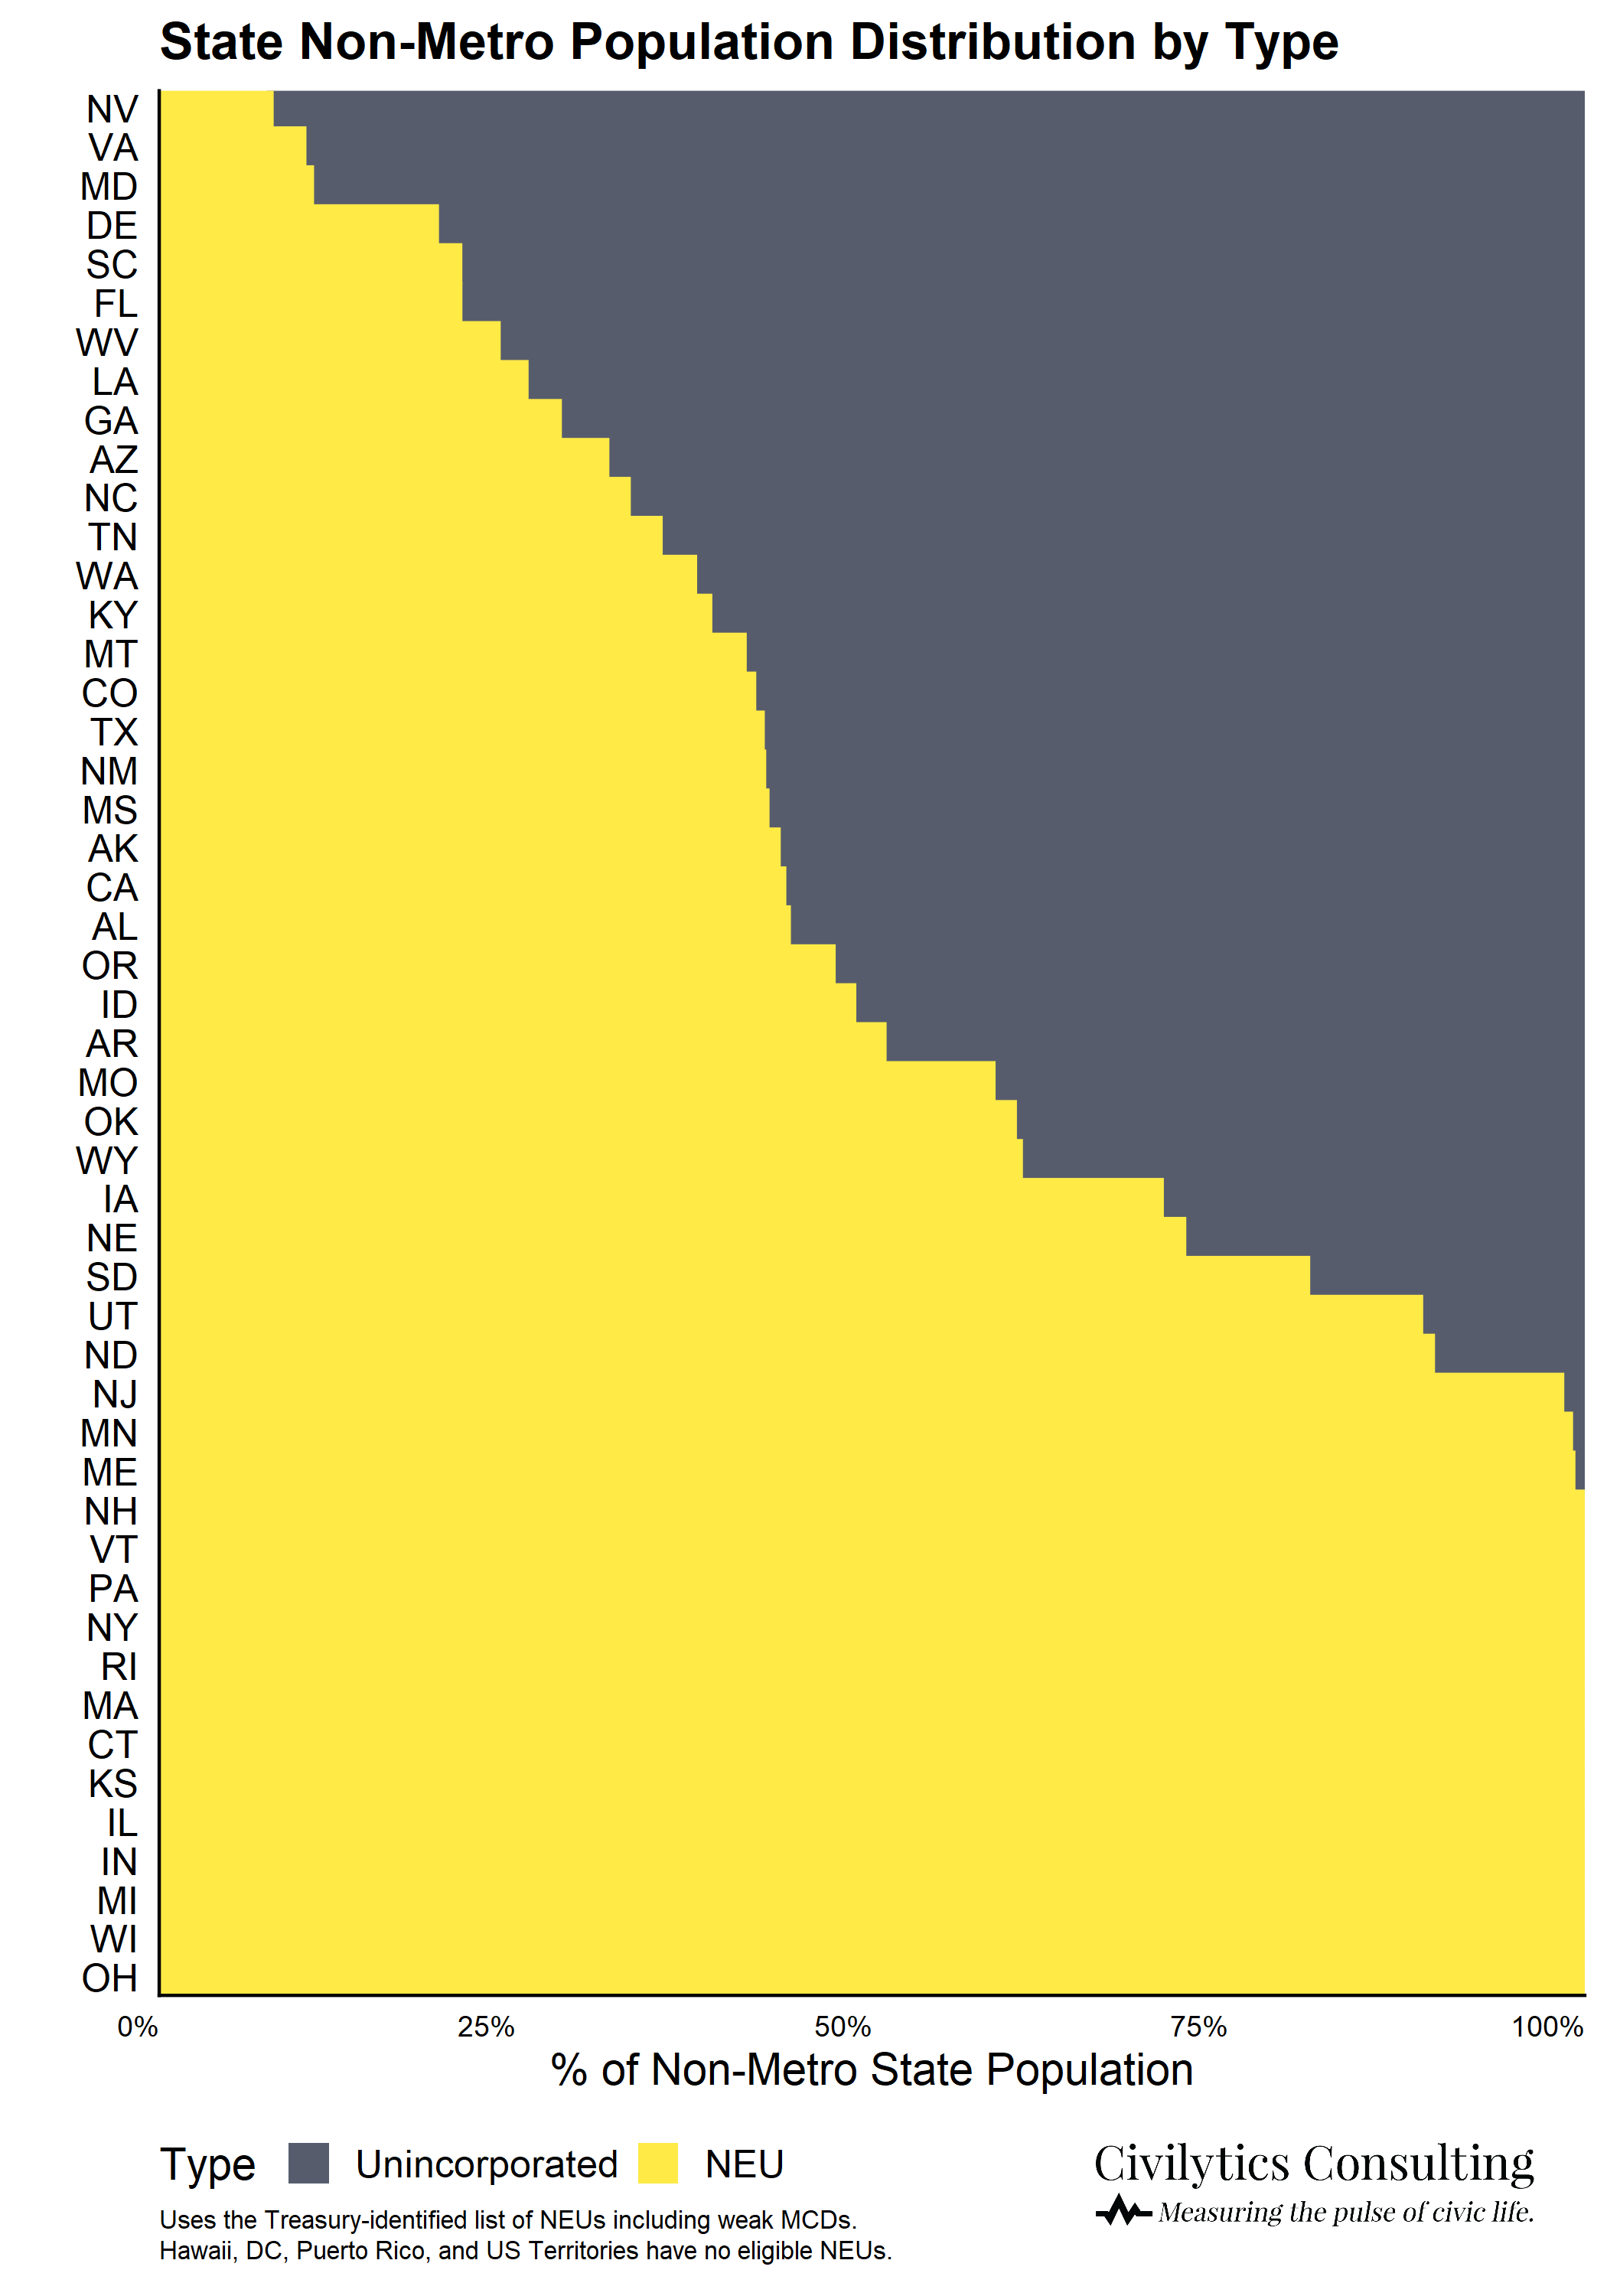
While nationally around one-quarter of people live in unincorporated areas, this varies greatly across states. 10 states have no residents living in unincorporated place. In other states, the majority of non-metro residents live in unincorporated places rather than “small towns” (NEUs).
States and their residents may choose to leave places unincorporated for a variety of reasons — to keep property taxes low, because they’re very rural, or because no one felt like doing the paperwork. But now this decision will affect the distribution of $19B in federal aid.
How much does the aid shift?
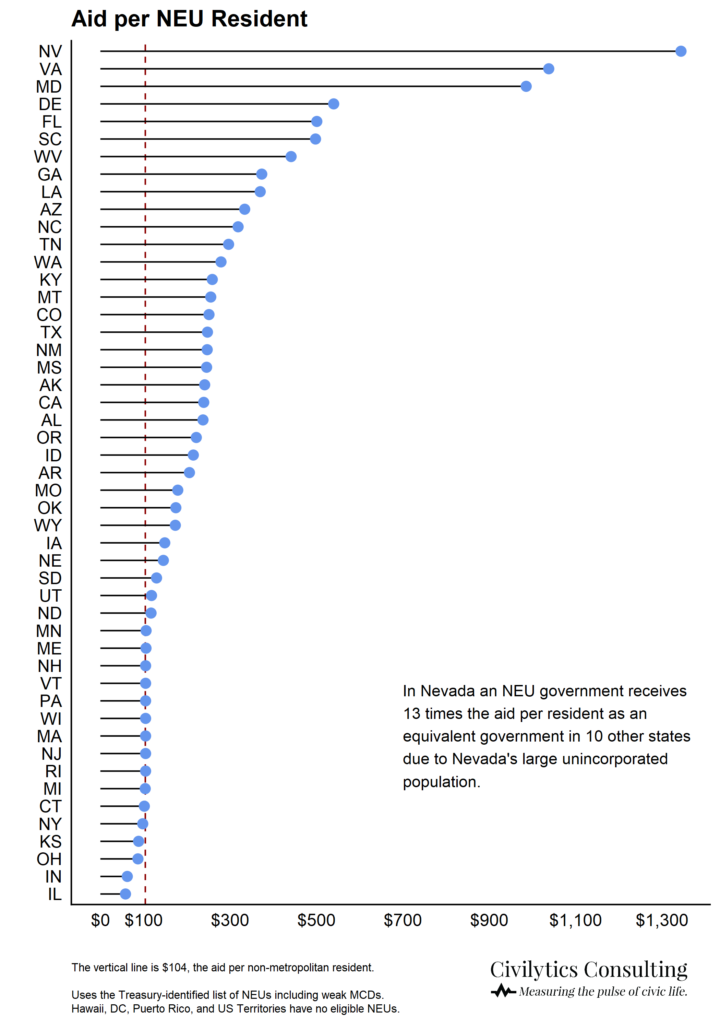
Civilytics’ estimates using the list of NEUs provided by Treasury coupled with the aid per state shows that the impact of this approach is substantial. Local “small town” (NEU) governments in Nevada may receive over $1,300 per resident compared to the $104 per resident received by local governments in 10+ states with no unincorporated population.

Why does the amount vary so much across states? In 10 states, all non-metro residents live in NEUs so these NEUs get the intended non-metro per resident allocation: about $104 per person. In other states, many non-metro residents live outside NEUs and so the NEUs in the state are dividing up a bigger pie relative to the population they serve (since unincorporated areas don’t receive funds).
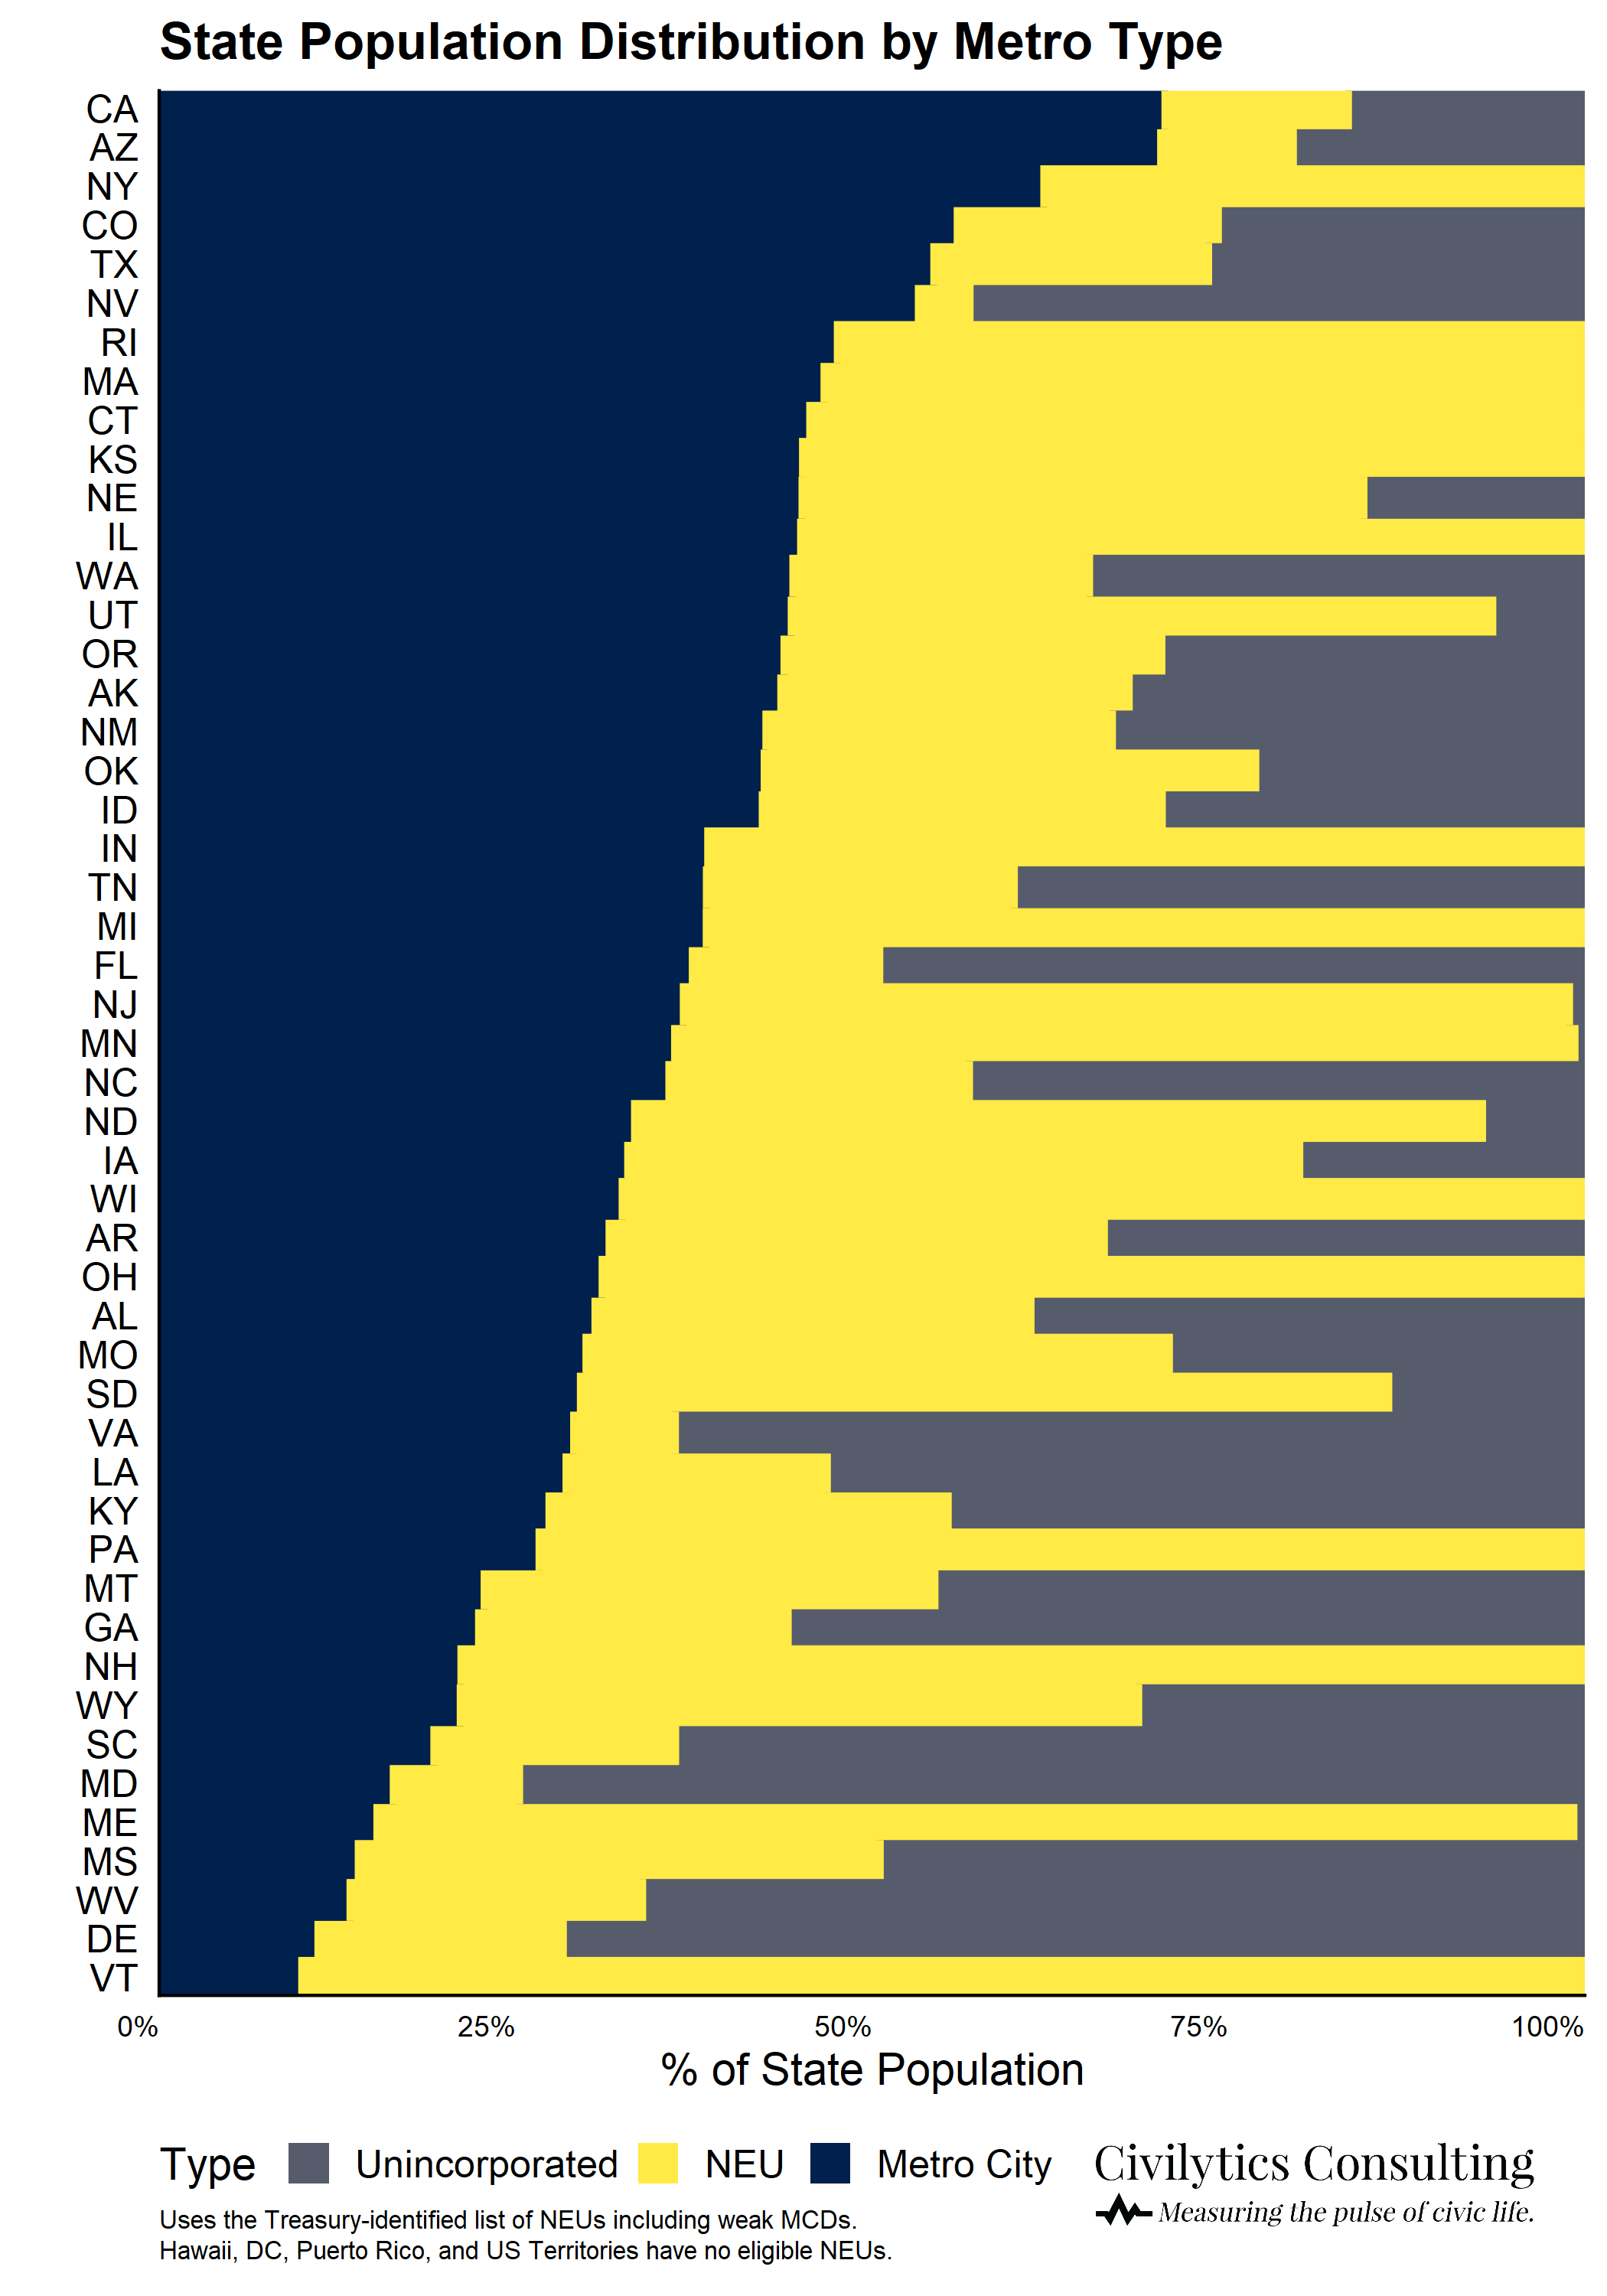
Let’s look state-by-state at the population living in metro cities, non-entitlement units (“small towns”) and unincorporated areas to further illustrate how this funding pattern arises.
Seven states — New York, Connecticut, Rhode Island, Massachusetts, Vermont, New Hampshire, Maine — do not have unincorporated places or have less than 1% of their population living there (see graph below). Nine more states — Minnesota, New Jersey, Michigan, Wisconsin, Pennsylvania, Illinois, Kansas, Ohio, Indiana — also join the list of states with 1% of their population or less living in unincorporated areas when using the broader definition of local governments (i.e., including weak MCDs).
At the other end of the scale, California, Florida, Georgia, Texas, and Virginia each have more than 5 million residents living in unincorporated places (which don’t have a local government and thus don’t receive this funding).
Small local governments (NEUs) in states with large unincorporated populations benefit from the “subtractive method” of allocation because the pool of money available to them is inflated by residents of areas that are not eligible to receive aid. The funding allocated to unincorporated populations will be redistributed proportionally among local governments that are incorporated, even if they do not provide services in those areas. This benefits local governments in states like Nevada and Virginia, which have the largest proportion of non-metro residents living in unincorporated areas.
When aid is distributed on a per capita basis to local governments in states with large unincorporated areas, unincorporated places will receive $0 per resident and non-metro incorporated places will receive much more than $104 person. In other words, local governments in these states will receive more (sometimes much more) per resident than an equivalent government in New York or Vermont.
Understanding the scale
To understand how much this matters for some communities, take 3 cities of around 50,000 people each.
- Milford, CT, has 54,747 residents and is expected to receive about $5.6M in aid, or $101 per resident.
- Azusa, CA, has fewer residents (49,974) but is expected to receive over twice as much in aid: $11.95M or $239 per resident.
- Stillwater, OK, is in the middle in terms of the amount of aid with 50,299 residents and a projected $8.78M or $174 per resident in aid.
This difference, over $5M in some cases, is quite substantial for a city of only 50,000 residents.
One more thought about why this matters
This doesn’t just matter to NEUs that are receiving less per resident than comparable governments in other states. People living in unincorporated areas — and the governments that serve them — are also shortchanged. Residents of unincorporated areas still receive and use services provided by local governments, just not necessarily by a town, village, or small city. In many cases, their county may provide more services than would otherwise be needed if there was another local government in place. While county governments are receiving a flat per capita aid of about $200 per resident, those dollars will probably go further in a county with fewer residents living in unincorporated places. Thus, another consequence of this funding decision is to advantage and disadvantage different county governments.
What can be done about it now?
There’s still time to smooth out some of this disparity. ARPA gave states the responsibility to identify and certify local governments eligible for aid. (Perhaps because a federal agency would be unable to do so in a timely fashion.) To make the funding more equitable within states, states could consider the following remedies:
- Rule as many local governments eligible as possible. Treasury has already identified that some states, like Kansas, Illinois, Ohio, and Indiana, will have to decide how to treat “minor civil divisions'” (MCDs) aid eligibility. As shown above, the more local governments ruled eligible (i.e., treated as NEUs), the smaller the distortion in per capita funding. (This does nothing to resolve the possible funding discrepancy between states but we’ll save that for another post.)
Assist unincorporated areas in becoming towns that are eligible to receive ARPA aid.Consider establishing temporary municipalities to transfer funds to county governments in recognition of the services county governments provide to unincorporated residents. (We’re not lawyers so mileage may vary.)(Treasury has issued updated guidance that makes it clear only NEUs on the list published by Treasury are considered eligible.)- Appeal to Treasury for guidance on how to better address the unincorporated population. Treasury is seeking comments until July 16: https://www.regulations.gov/document/TREAS-DO-2021-0008-0002
The Fiscal Stabilization Funds are flowing, but they will keep flowing for the next 12 months — which gives everyone time to adjust. In the meantime, you can use our tools to find an up-to-date estimate of funding for all localities identified by the Treasury, both per capita and overall.
Why did this happen, and how could it been done differently?
We have tackled that question now in part 2.
For now, a teaser…
- The legislation was amended by the Senate to change the formula to use the non-metro population instead of the NEU population. It is unclear why this change was made, but the result is a $5 billion shift in allocations among states due to a change in just five words in the provision.
- Treasury chose not to publish populations for metro cities or the funding amounts for NEUs, which hinders efforts to understand the implications of the allocations and to replicate or analyze Treasury’s funding rules. (We spent a week doing just this.)
How can I check your work?
It’s easy! It took us a while to figure out what to do and how but now you can easily replicate the results yourself. This Treasury document has each state’s total allocation for its non-entitlement units, and this Treasury spreadsheet has the list of eligible NEUs and their population for each state. Simply sum the NEU population for each state, then divide the state’s NEU allocation by that number to determine the per-resident NEU aid for that state.
- *Called this because they are not entitled to direct disbursement of funds from Treasury, but instead will receive funding after certification from their state or territorial government.
- †The federal government collects a Census of Governments that does not allow it to map those governments onto residents and it collects a Census of residents that does not include information on the governments those residents belong to.