
In memory of Jim Knowles
Content warning: grief, loss of a parent
A little over a month ago, on May 7th, my dad, Jim Knowles, passed away unexpectedly. He was 66 years old. For me, the world just kind of stopped. My dad and I were very close and I’m still figuring out my way forward.
I’m breaking from our regular coverage at the Civic Pulse to talk about my dad. Regular issues of the Civic Pulse will return soon, though the schedule may be a bit slower the rest of this year.
For now, thank you for reading. I hope this conveys why my dad meant so much to me.
My dad was a problem solver.
He was a deeply curious person who never stopped growing, changing, and discovering new solutions to the puzzles life gave him.
To understand what I mean, you need to know a little more about his early life. My dad’s family was never good to him. I won’t air too many details, but, to illustrate, I didn’t have a relationship with my dad’s brother or parents. My dad’s childhood and early adulthood was full of criticism and bullying by his brother and mother. They spread rumors about my mom and were cruel to her family. They ridiculed and demeaned my dad for not being who they wanted him to be. If it happened today, we’d say my dad was subject to constant emotional abuse.
This was perhaps the greatest problem my dad solved – being the complete and total opposite kind of spouse and parent. And that wasn’t easy! The Knowles clan–we’re more different than we are alike, and we all presented Dad with different challenges.
The profoundness of our grief now is a reflection of his great success at solving those puzzles.
I want to talk about how my dad solved the puzzle that is me.
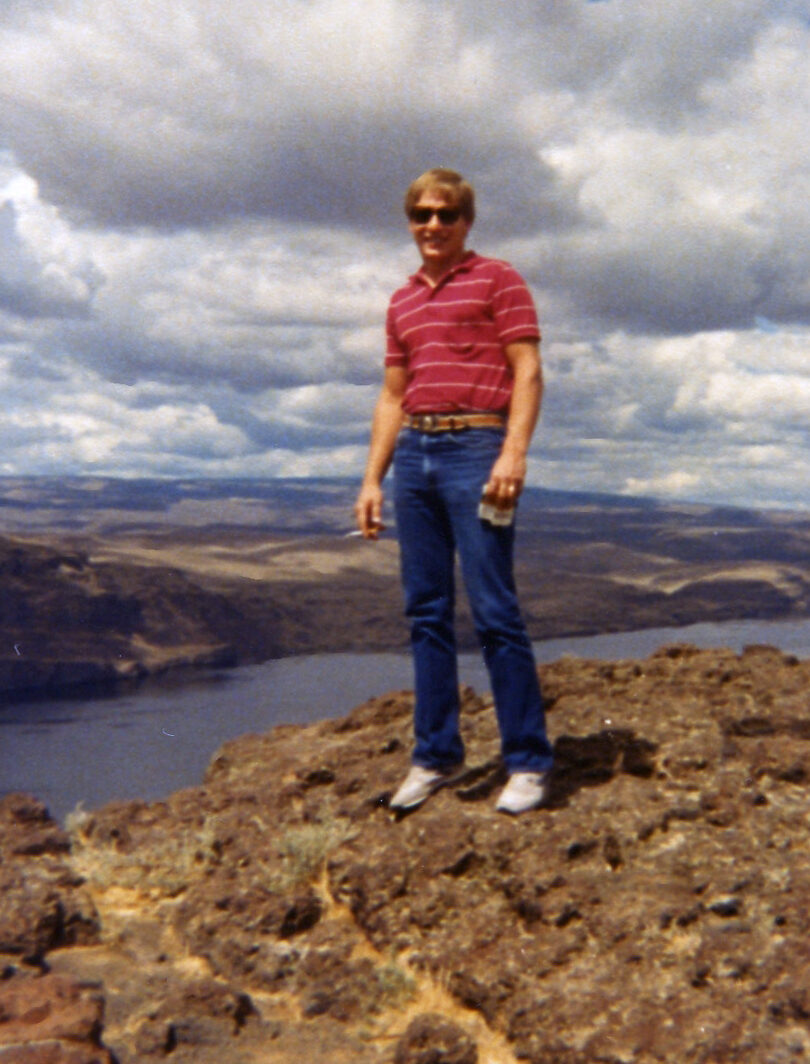
It starts with geography. I’m from Montana and, growing up, it seemed like there wasn’t a corner of the state my dad hadn’t touched. There wasn’t a hidden road he hadn’t taken. My dad loved taking a new road just to see what might be in the next valley or over the next mountain.
This was, in part, because his work required it. And when I think of my dad, I definitely think of hard work. And I mean hard.
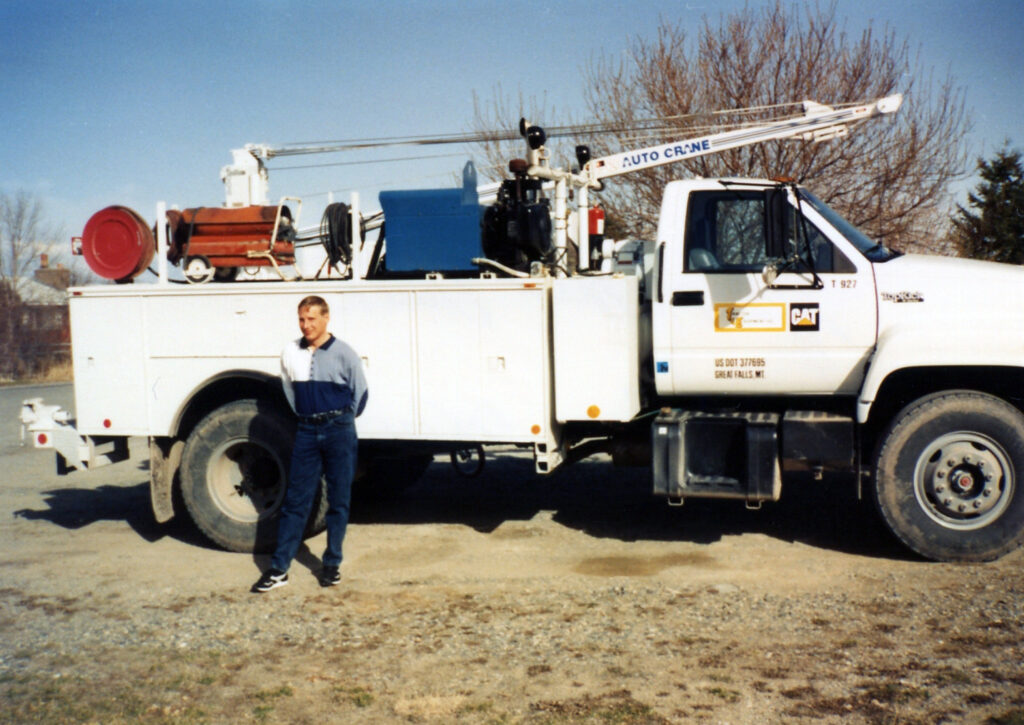
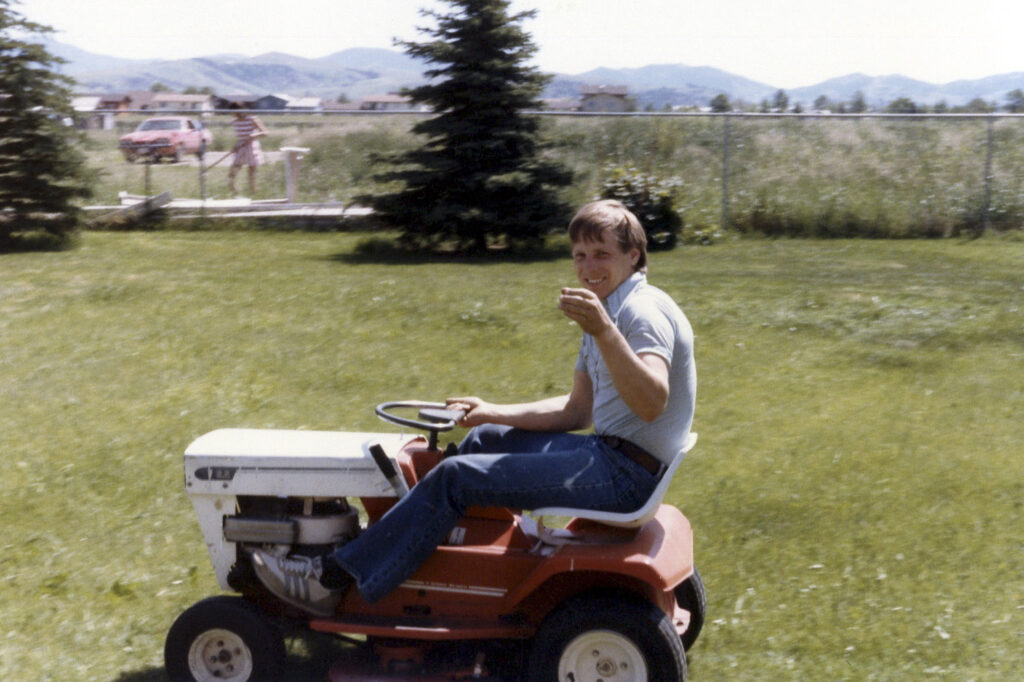
My dad was a field mechanic for the early part of his career. If an expensive piece of equipment broke at a construction site, logging camp, or mine in western Montana, they’d send my dad and his truck. He spent long hours on the road and longer hours crawling over and under huge machines to keep them running. It’s hard as a 6-year-old to imagine a cooler job than driving and fixing bulldozers, excavators, and loaders bigger than your house. It’s hard as an adult to imagine the determination to spend a 60-hour work week away from your family at a mine on some remote mountain, then drive home to your family every weekend. Often, he’d come home to a lawnmower that needed an oil change or a carburetor out of whack on the family car. I get tired just thinking about it.
My dad was gone a lot when I was a kid but he always found ways to be present. Another puzzle he solved: in the mid 1990s, before cell phones, my dad found a way to make sure he could call us from his CB radio no matter where he was in the state and that we could call him. AT&T still hasn’t figured out how to pull this off.
Later that decade he convinced his employer we needed a second phone line at home so he could fax in his time sheets, giving us access to always-on internet earlier than most people in the state. He also was one of the first field mechanics to replace service manuals with a laptop – and if you guessed who benefited from using his laptop almost as much as he did, you’d be right.
I picture my Dad now, driving his big service truck alone on some rutted out road, thinking about us. It’s so obvious that we were always on his mind and that he was always finding some new way to spend more time with us or connect with us.
I could give you a million more stories, but I want to talk a bit about me and the challenge I was to my dad. To do that, you have to understand one of the biggest puzzles my dad had to solve: how he could get out of that service truck and home with us. He knew that working outside 60 hours a week in Montana’s bitterly cold winters and blistering hot summers wasn’t sustainable. A couple of knee surgeries and shortage of overtime led him to look for something more predictable and indoors. That led to us moving across the state so Dad could take a job advising field mechanics, not being one.
That move across the state, away from my childhood friends to a new high school, made me angry with him. Now though I can see clearly that, even when I was a selfish teenager trying to be different from my dad, he was there supporting me no matter what. He judged debate tournaments. He drove me to a college visit 13 hours away that I desperately wanted to go to. He found me another vehicle after I wrecked the car I begged him to buy me. And he was always there encouraging me to do well in school, stay focused, work hard.
But when I was 18 I thought we’d never have anything in common. To me, I was a booksmart, confident (maybe arrogant) teenager who wanted to see the world outside of Montana and never look back. My dad was a hardworking company man who didn’t see the appeal of much else beyond the Last Best Place.
Now, at 36 my heart is breaking thinking about not having him to talk about everything with anymore.
What a turnaround.
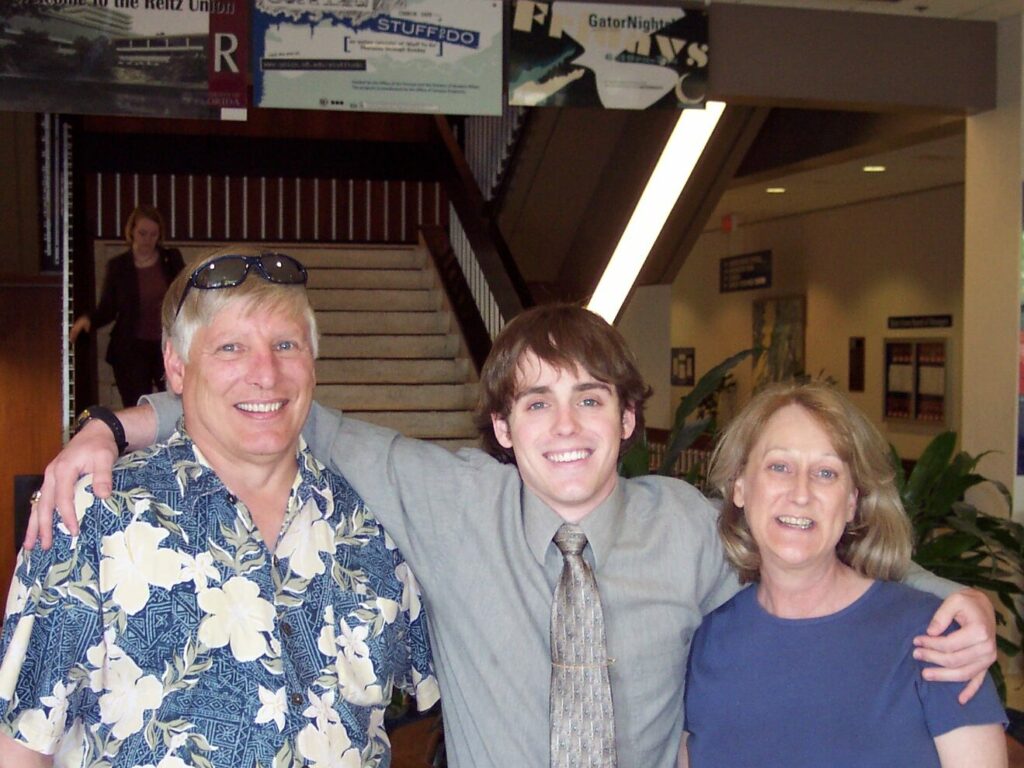
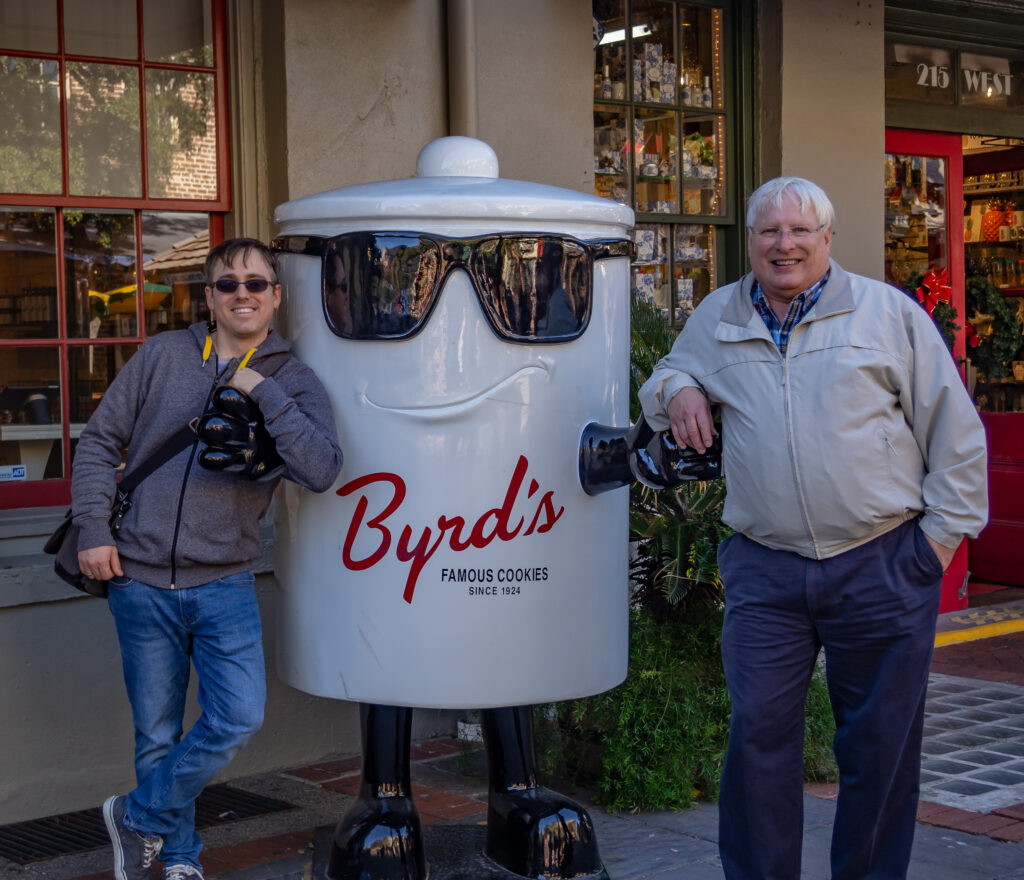
I left Montana like a rocket bent on breaking orbit – going from Oregon, to Germany, to Wisconsin, and now to Massachusetts. Geography was a problem, but so was life. There was Dad (and mom too!) – sending emails, talking on the phone every week, finding common ground. Texting. They even met up with me in a few random places – Orlando for a debate tournament, Savannah a few years ago for a quiet beach Christmas.
It hurts because I do feel like I was just starting to appreciate this about my dad. He died before I got the chance to ask him how some of these things looked from his side, how he did it, what it was like.I feel sad, even cheated I didn’t get to talk about it more with him.
My dad was a meticulous, quiet guy. It would be easy to mistake the quietness for stillness, but there was nothing still about him. He was always solving the next puzzle, learning the next new thing. We found so many things to laugh about and think through together. Just a few of the topics I’ve been recalling that we talked about recently:
- The utter bleakness of teaching a Zoom class to all black squares
- Whether reparations are politically possible
- Whether I should take the plunge and get an electric car or wait a bit longer
- How frustrating and tedious hanging drywall, door and window trim can be
He did the same for my siblings and, in a way, learning about those things he talked about with each of us is bonding us now, just the way Dad always was doing.
When I went home to be with my family a few weeks ago and sat down in his home office (which he called his Male Room–he was also wickedly funny), everything was perfectly organized. All of his projects organized in his filing cabinet and in the folders on his computer. Everything labeled and in its place.
If you read this far, thanks for letting me share a little bit about my dad with you. It helps. He was so much of who I am. He was also an avid reader of the Civic Pulse so it feels right to celebrate him here.
As I said on LinkedIn/Facebook: He became a kind and gentle man in a time and place where that was anything but easy. As a son, I’m very fortunate that my dad didn’t leave me with any big questions – he always let me know he loved me and that he was proud of me. He just left me with a lifetime of little questions. And one big hole in my heart.
You can read more about him in the obituary my family put together here.
Thank you.
Jared