
Plus why the timesheet and benefits portals at your job are so bad
As I logged into two separate government “vendor portals” to submit invoices and type in the same business information I have input dozens of times before, I was reminded of how frustrating the software we are forced to use every day can be. For the most part, when we think or talk about Big Tech, we think of consumer technology companies like Google, Facebook, and Twitter. But there is another Big Tech – Big Dull Tech (BDT) – that is responsible for shaping the operations of tens of thousands of state and local governments (and many other orgs) across the country while billing the public billions and billions of dollars each year.
In this newsletter I want to show you how Big Dull Tech exerts a tremendous but invisible influence on how government agencies run. In a world increasingly dependent on data, the limited supply of Big Dull Tech vendors poses very real limitations on the capacity of government to meet our needs.
In this issue you’ll find:
- What you need to know about Big Dull Tech
- West Hollywood reimagines public safety by revamping its budget (with a small role by yours truly)
- Our link roundup
As always, thank you for reading. On to the topics.
What you need to know about Big Dull Tech
What is big dull tech?
Companies like Oracle, IBM, and SAP run everything from payroll and accounting to predictive analytics that determine aid eligibility for government programs across the country. In many cases, the software and staff of these IT vendors have replaced entire government departments.* The software and database implementations sold by these companies silently constrain the policy decisions of agencies every day. What’s more, these constraints arise from decisions made by (mostly white, highly-paid) employees of IT vendors, located far from the communities where the data come from and where the resulting policies will matter.†
Relatively little attention has been paid to effects of big government tech companies, their software, and their policies on the erosion of quality employment, self-determination, and innovation in communities or the associated impacts on racial equity.‡ Government jobs in developing software have been replaced by service agreements with vendors who employ workers in distant cities with no connection, context, or accountability to local communities.
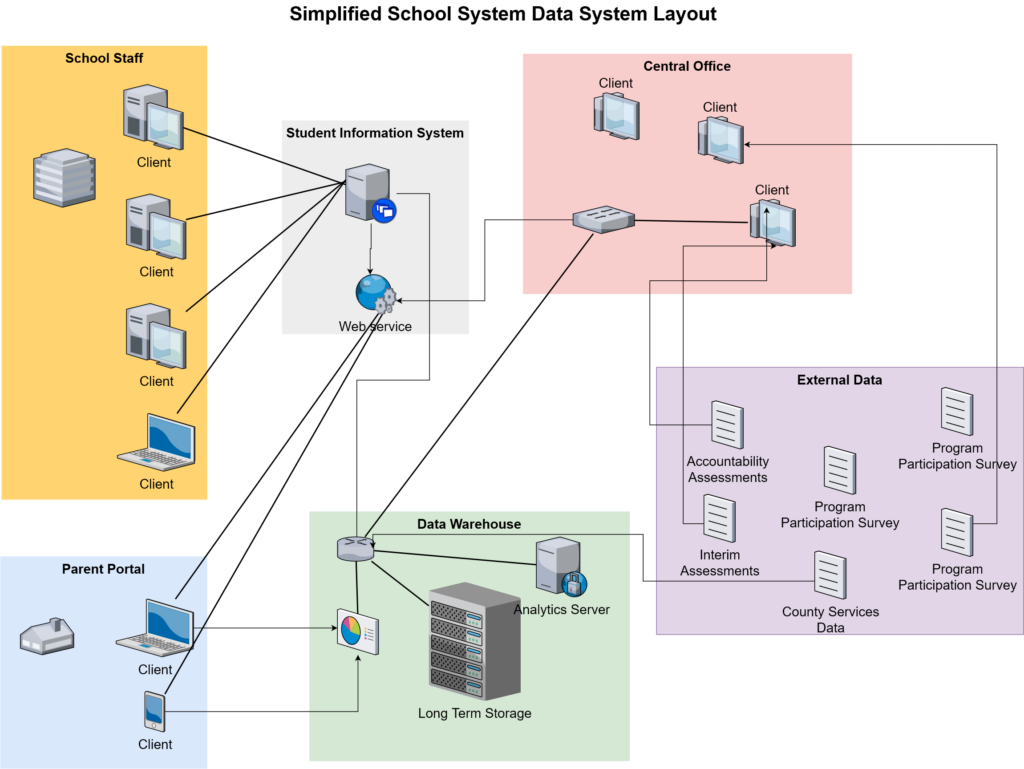
Big dull tech in action: school districts
Take the example of Gwinnett County Public Schools in Georgia. This award winning and innovative school district is a national leader in data use and data analytics with many talented data analysts and data engineers from and living in the county who support the work of a district serving 180,000 students. [Shout out to any of them who may read this newsletter!]
Yet even a school district with as much local talent as Gwinnett outsources much of its key technology infrastructure due to policy and budgetary constraints. These vendors are private companies whose predominantly white affluent shareholders and owners benefit from Gwinnett’s tax dollars. They are constantly looking for ways to shrink the market into a series of monopolistic choices that lock customers in and inhibit the flow of data, staff, and solutions within the public sector.§
When locked into these proprietary systems, talented employees at a place like Gwinnett have to work around the limitations of their software and find it difficult to share and benefit from the talent of developers in neighboring or peer school systems across the country.
This is widespread and it enables structural inequality
There are a thousand more examples across the country, places with the talent for an innovative public technology sector but instead beholden to tools sold by a shrinking pool of a few big companies. These compounding missed opportunities silently uphold many systemic drivers of racial inequality. The practice of contracting with big dull tech denies high-paying job opportunities as data engineers and software developers to local residents of color. It stifles more diverse pathways to enter IT professions through government jobs or entrepreneurial opportunities with the government sector. It extracts the data from these communities and puts the information in the hands of these vendors, in some cases to be commodified and resold.¶ And it insulates the government, through abstract data systems, from local knowledge held by directly impacted communities, making such systems politically weak and ineffective.
Is this the biggest driver of systemic racism in our institutions? Absolutely not. But, it is something that could be addressed, now, in thousands of departments and agencies nationwide.
What is all this software the government needs?
Software and data systems are quietly becoming the backbone upon which most social services rest. Here are some examples of the IT systems your local government probably uses and could choose to buy differently:
- Enterprise Resource Planning (ERP) systems
- Student information systems (the backbone of K-12 education systems)
- Homelessness management information systems (used for case management)
- Case management systems (for other forms of case management)
- Record management system (used by, among others, law enforcement agencies)
What can we do differently?
Most of these applications are simply methods of inputting and then reporting back data in a distributed fashion. In software development terms, these are just variations on the classic Create Review Update Delete (CRUD) database application theme. There are hundreds of open-source CRUD applications built on open standards and made for interoperability. (We use some of them here at Civilytics!) Students in your local high school probably learn to code these applications in a high school computer science course.
Yet the adoption of open versions of these systems in the public sector remains rare and radical.
Software is infrastructure, why do we buy it so differently?
Let me pause here and make a metaphor. Most communities have a bridge of some kind. There are tens of thousands of bridges in the country today. Similarly, almost every medium to large organization – private or public – needs an ERP system. There are hundreds of thousands of ERP installations in the country right now. If we built bridges like we build ERP systems, it would look something like:
- Community writes a request for proposal and solicits bids for the bridge expecting to receive 2-3 bids, all suspiciously close in price
- Community chooses 1 of the bidders, Bridge Tech
- Bridge Tech sends in a team of technicians from its corporate headquarters in San Francisco and tosses up a bridge quickly that looks like many other bridges it has recently built
- Community asks for changes to meet the original proposal requirements
- Bridge Tech says those changes are only available to customers using their new bridge process (Bridge 2.0), coming out next year
- Community modifies contract and purchases Bridge 2.0
- Bridge Tech says it is easier to just build Bridge 2.0 from scratch instead of upgrading Bridge 1.0
- Community asks for some small changes to Bridge 2.0, some community members still use Bridge 1.0…
- Frustrated, community goes out to bid for a new bridge and expects to receive 2-3 bids… the cycle continues
Not only does the product suffer, but the imagination of even what can be done is constrained to what vendors are willing to put on the marketplace. This narrows our vision for what we can do collectively and constrains the ability of our government to solve emerging and novel problems.

So how did we get here? The dominance of specialized IT vendors is the result of policy, regulation, and funder practices. First, federal and philanthropic data initiatives incentivize vendor partnerships through short project timelines and limited one-time funds that cannot support ongoing staffing.# Vendor subscriptions are more expedient, easier to justify in the budget, and often given little attention or scrutiny when reviewing applications or proposals.**
At the same time, political leaders and administrators often don’t see the geographic and racial equity impact of operating in this way and are unaware of the missed opportunity of building and maintaining their own tools. While some perceptive leaders may at least realize that outsourcing vendor contracts deprives the local community of skilled jobs, few realize that local positions would also create more opportunities for community voice to actually inform government administration as implemented in data and software.
Interoperability and openness is how our democratic infrastructure needs to work
Another way is possible. By promoting homegrown talent development, adopting open source and interoperable data solutions, and fostering cooperative software development, the public sector could create the space to keep tech jobs, tech funding, and tech knowledge in local communities. Many policies are worth exploring to break the hold of BDT companies and create more equitable employment opportunities and governance. Possible policies include:
- Funding transitions away from proprietary vendor-specific technologies toward open technologies with interoperability standards
- Encouraging local employment for many standard government data functions such as database administrators instead of relying on annual vendor support contracts employing remote staff
- Creating meaningful training and skill development programs to ensure a steady pipeline of local talent to fill government data jobs and support a more diverse ecosystem of service providers
I’d love to hear from you
Big Dull Tech is an area where I think we can have a unique impact at Civilytics. We are always on the lookout for efforts to change this paradigm. If you’ve had an experience where your organization replaced a BDT contract with homegrown talent and training, we’d love to hear about it. Just hit reply and send me an email.
And, I know some of you may work at vendors like I am describing – I’d love to have a dialogue about how vendors can be part of the solution as well.
West Hollywood reimagines public safety by revamping part of its budget
A broad coalition is working together to re-imagine community safety and social services in Los Angeles County. In 2020, this group succeeded in passing a historic ballot measure that committed the county to invest in social services. Two years later, the county has continued to resist disbursing the funds, allocating only about a quarter of the required funds.
The coalition has kept up the pressure, however, working on multiple fronts. One recent front resulted in West Hollywood scaling back its spending on the LA Sheriff Department’s (LASD) contract, instead expanding its non-armed security ambassador program. According to JusticeLA, a coalition of grassroots groups, this is the first time in LA County history that one of the 42 cities contracting with LASD has successfully challenged rising costs.
This fight was spearheaded by West Hollywood Public Safety Commissioner Nika Soon-Shiong, who uncovered documents showing that the cost the LASD charges West Hollywood for a deputy has vastly outpaced inflation and that the spending and staffing levels provided to WeHo have no correlation with incidents of crime.
Working with Commissioner Soon-Shiong, we reviewed multiple rounds of documents from the LASD, many of which were not initially publicly available and which had conflicting statements about costs. Only with publicly agreed upon budget and crime numbers – which represent the public’s money!– could the city then begin to discuss whether that cost and investment was appropriate.
In retrospect, the evening I spent waiting to testify to the West Hollywood city council instead of watching the championship game of the men’s NCAA tournament feels worth it. You can read a more in-depth recap of the whole WeHo story in one of my favorite Substack newsletters by Jessica Pishko.
Next time on the Civic Pulse
Hannah and I have been talking a lot about some recent major media failures – how publicly invisible the Equal Rights Amendment has been, more important than ever after Dobbs, and how the arrest of 17 members of Congress for exercising their first amendment right didn’t even rate front page status on the Washington Post. We’ll have more to share about this in an upcoming issue.
Link Roundup
Are we committing real resources to alternative solutions to preventing violence or not?
With the midterms coming, Democrats are once again sure to be mired in internal debates about messaging, with “defund” being one of their favorite debates. Policy Research Associates has been looking at how much “defunding” has actually occurred (spoiler, not much) and how much communities are choosing to reinvest in violence prevention strategies (spoiler, sadly even less). The rhetoric has changed and the debate is fierce, but the budgets march on.
Sometimes the “information system” is just one tireless person
Here is how one person is working to hold together a system of social services that has been underfunded and undervalued for too long.
An intimate and gripping view of why we need new solutions to public safety (and public transit, and housing, and healthcare…)
Speaking of hardworking individuals, this profile of Suna Karabay, a bus driver in Denver, is a portrait of patience, grace, danger, and how our interlocking crises are showing up every day. I could not stop reading this even though it broke my heart more with each paragraph.
Facebook surveils applications for federal student aid
Big Tech is also up to shenanigans, sometimes in unlikely places. Federal student aid intersects with Facebook surveillance (sometimes Big Tech’s reach seems unbelievable)
Diesel exhaust is deadly and we can quantify it
I really love a good application of data + modeling to make visible the invisible things that affect our quality of life. This one is a bummer, but it is fascinating to see how much we know about how and where long-term exposure to diesel exhaust is deadly. This interactive map measures how much diesel exhaust different areas are exposed to and estimates the toll on human life.
The scam that is Medicare Advantage
I’ve only recently become more aware of the array of benefits retirees and seniors try to navigate – so I didn’t know this before but you may have: I guess Medicare Advantage is a backdoor to privatizing Medicare and it’s getting worse?
Handy data tool alert for economic data
Data alert: If you were intrigued by the FRED data on wages and house prices in the March newsletter, good news–you can get data from FRED inside of Excel. Excel isn’t all bad!
Monopolies and license fees are coming to your junior and high school esports
Finally, you may know that I enjoy watching esports. Unfortunately, even esports are impacted by monopolies. One company is trying to corner the market on junior and high school esports competitions by making schools pay to play. By the way, my preferred esport, Starcraft 2, is free to play and your school can set up and play tournaments today!
Postscript to last issue
Thank you everyone for the kind words you sent in response to the last issue dedicated to the memory of my dad. I was truly touched that so many of you appreciated learning about him and shared your sympathy and thoughts. I know he’d be so proud about the connections I am lucky to have with so many of you.
As always, we appreciate your help spreading the word about this newsletter. Thanks to those of you who have been doing so recently, our subscriber numbers have been growing! If you haven’t already, please subscribe. If you subscribe, send it to a friend, or share it on social media.
With gratitude,
Jared
- *For example, in Automating Inequality, Virginia Eubanks studies the impact that these decisions had as benefit agencies in Indiana lost control over eligibility determinations to a vendor contract.
- †Jamila Michener, in Fragmented Democracy: Medicaid, Federalism, and Unequal Politics, describes the impacts on our democracy and on participants when administrative decisions about government benefit programs are completely insulated from any voice or input of those they are intended to serve.
- ‡Ruja Benjamin’s The New Jim Code is a powerful exception, shining an important light on many of these and related issues.
- §For example, school districts rely on a core piece of software called a Student Information System to manage everything from grades and absences to standardized assessments and student medical information. There are now only two major vendors remaining: PowerSchool and InfiniteCampus. Staff trained in one must be retrained to use the other, at great expense.
- ¶One example here is the case of student college enrollment data collected by the National Student Clearinghouse, the canonical data collection on student college enrollment used in higher education policy and research, and entirely owned and operated by a private company despite huge investments of data into the system by state education agencies and colleges.
- #See the Bloomberg “Smart Cities” initiative and the Institute of Education Sciences State Longitudinal Data Systems (SLDS) grant program for examples of each.
- **I have seen this firsthand as an SLDS grant reviewer for the US Department of Education.