
Plus our takeaways from an important new study on deaths due to police
If you’ve been reading this newsletter then you are probably familiar with gerrymandering, but are you familiar with “prison gerrymandering”?
Each year more than 2 million people are imprisoned, often far from home. Prisons are highly concentrated pockets of people who are usually held in otherwise sparsely populated areas. The Census counts prisoners as residing at the prison, as opposed to their last home residence. The way that these facts combine to reduce the political power of more racially diverse urban areas and increase the political power of whiter rural areas is known as “prison gerrymandering” and we have two new resources — a dashboard and news article — related to this topic to share with you in this edition of the Civic Pulse.
In this edition, you’ll find:
- Our new dashboard on prison gerrymandering
- A more detailed look at prison gerrymandering in Wisconsin
- Our takeaways from a landmark study about underreporting deaths due to police violence
- Applications are open for the Strategic Data Project
- A roundup of what we’re reading
As always, thank you for reading. On to the topics.
New dashboard about prison gerrymandering
We are very excited that our new dashboard created with Lovelytics for the Tableau Racial Equity Data Hub is now live! Please check it out along with our post introducing the dashboard and a second post explaining the data and methods in more detail.
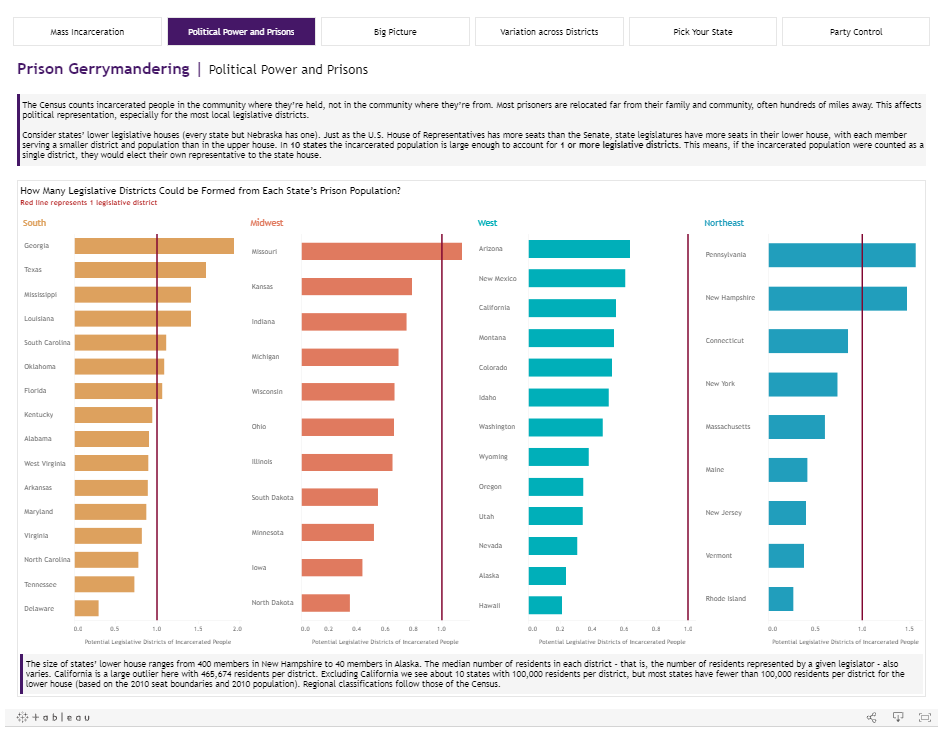
The dashboard focuses on prison gerrymandering, which is the practice of counting prisoners where they are confined, often far from their home, for the purpose of redistricting. It couldn’t be a more important time to understand this issue as states redraw their legislative districts using 2020 Census data. Decisions made now will affect political representation for the next decade — and 11 states have resolved to end this practice!
Here’s the fact we were most surprised to learn from the project: In 10 states, an entire state legislative district could be formed from prisoners. That is, in 10 states, if the incarcerated population were counted as a single district, they would elect their own state representative.
We also learned that:
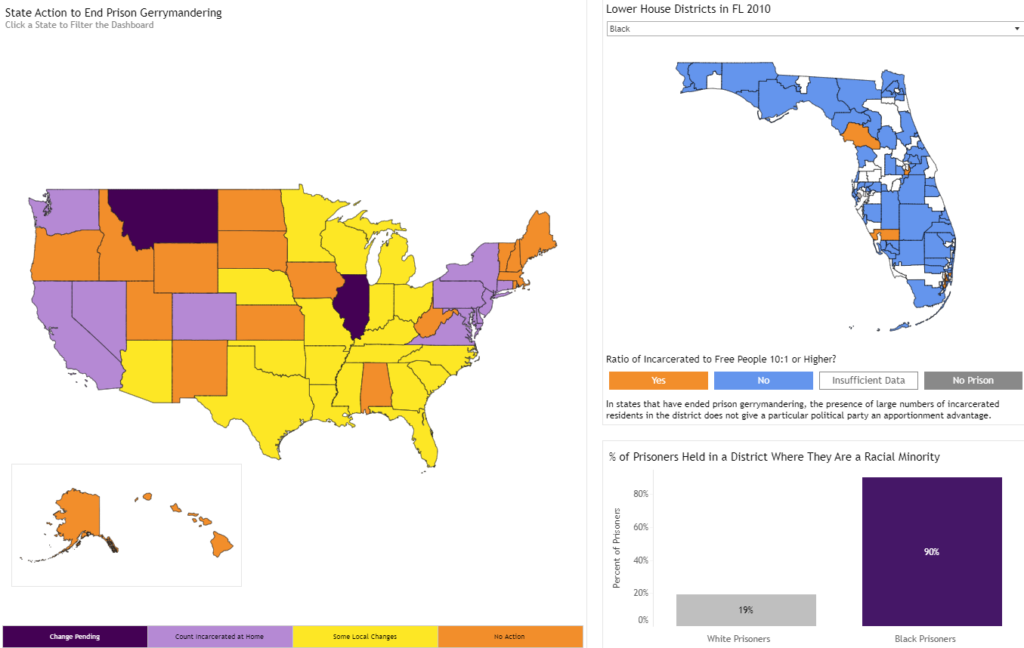
- In every single state, Black/African American people are a higher share of the prison population than the non-incarcerated population.
- In 26 state legislative districts, over 10% of the entire population is incarcerated. In 500 districts, more than 10% of all Black people in the district are incarcerated!
- 24 out of every 1,000 Black people were in prison in 2010 compared to only 4.5 out of every 1,000 White people.
We do want to convey some hopefulness here, not about mass incarceration and racial disparities but about ending this particular form of gerrymandering. In the 2010 redistricting cycle, only a few states addressed prison gerrymandering but, this decade, 11 states have resolved to end the practice (and a 12th, my home state of Montana, might do so soon!).
The Prison Policy Initiative tracks the latest state developments very closely and has lots of great resources, including information on state-specific groups working to end prison gerrymandering. Check out their website to learn more.
As we mention on the dashboard and in the posts, this analysis was inspired by and benefited greatly from the Prison Policy Inititative’s work, particularly Peter Wagner and Daniel Kopf’s 2015 report “The Racial Geography of Mass Incarceration.” The dashboard builds on PPI’s analysis to focus on legislative districts rather than counties and, thus, to focus on prison gerrymandering more directly (though it introduces some methodological challenges described in our post)!
We hope you’ll check it out both for the national patterns and to better understand the status of prison gerrymandering in your state.
Zooming in on prison gerrymandering in Wisconsin
Listen up all you Badgers in the audience — this one’s for you:
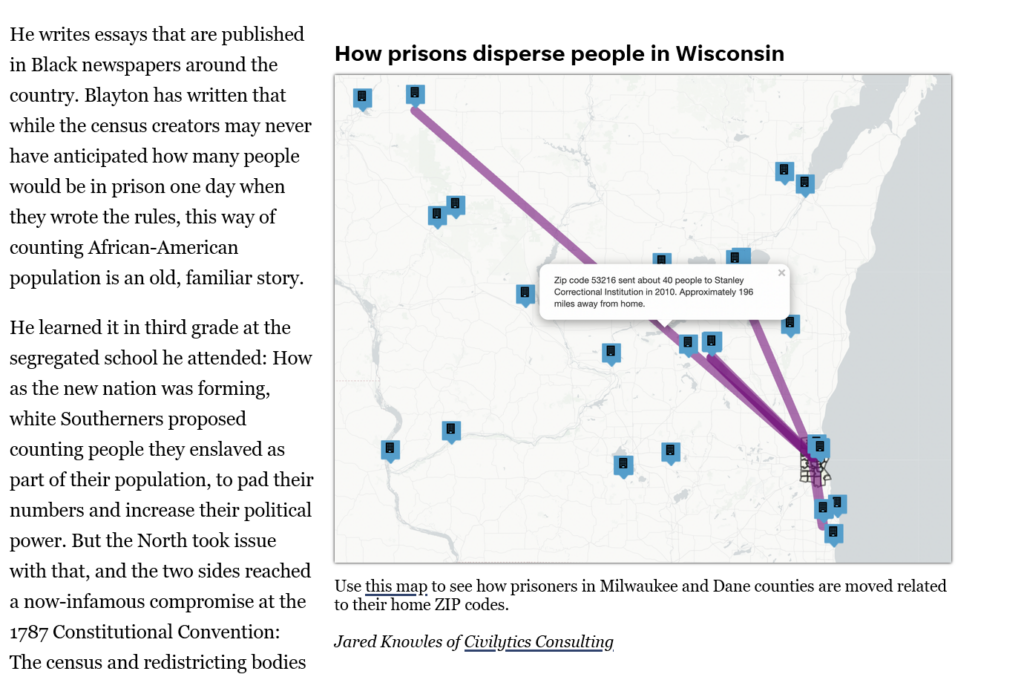
I’m very excited about this new story from Natasha Haverty in the Milwaukee Journal Sentinel. Natasha explains where prison gerrymandering is happening in Wisconsin, who is working to change it (and who isn’t), and what some strategies for change are. What I appreciate most about the article is the quotes from multiple legislators, both those who benefit and are harmed by the practice.
Please check out the story including the interactive charts I contributed for the story. And please share with your networks if you think they’d find it interesting!
Our takeaways from a landmark study on underreporting deaths due to police violence
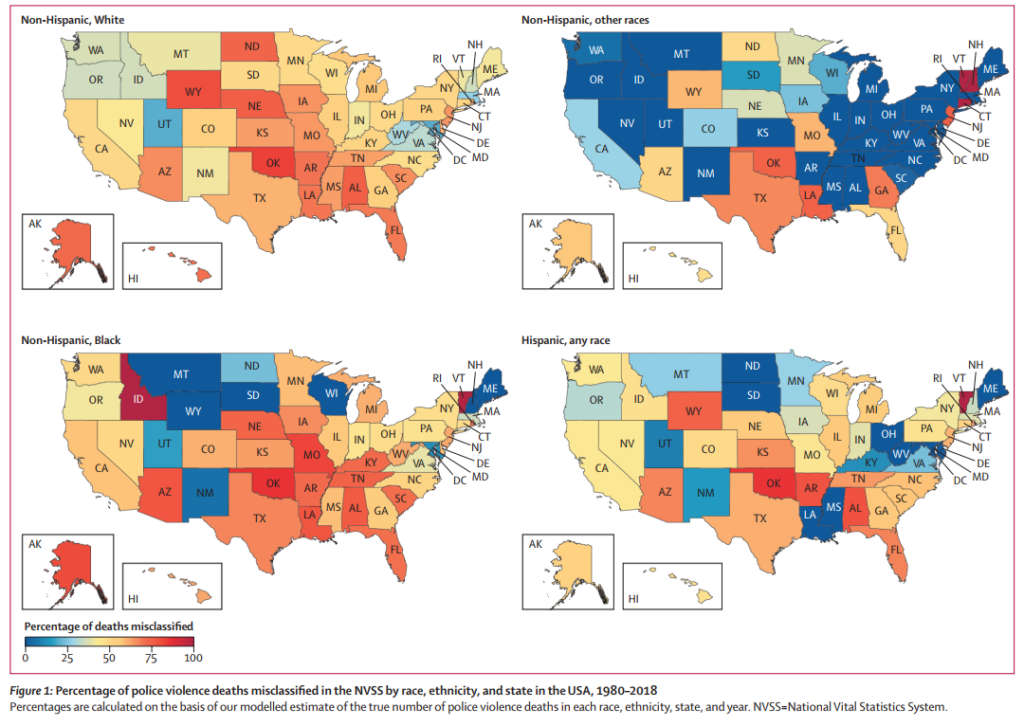
Did you see this new article in The Lancet (a British medical journal) examining fatal police violence by race and state? The study found that official government death records did not correctly report over 50% of all deaths attributable to police violence. Over 30,000 people died from police violence in the last 40 years (1980-2018) but less than half of those deaths were officially attributed to police.
https://www.thelancet.com/journals/lancet/article/PIIS0140-6736(21)01609-3/fulltext
The study found that rates of underreporting deaths due to police violence vary greatly across states. The 5 states with the highest underreporting rates were:
- Oklahoma: 83.7%
- Wyoming: 79.1%
- Alabama: 76.9%
- Louisiana: 75.7%
- Nebraska: 72.9%
In these states, more than 7 out of 10 deaths caused by police were miscategorized as attributable to another cause.
The five states with the lowest underreporting rates were:
- Maryland: 16.4%
- Utah: 19.8%
- New Mexico: 26.4%
- Massachusetts: 32.5%
- Oregon: 36.3%
Other findings include:
- Rates of underreporting varied significantly by the victims’ race/ethnicity. The greatest underreporting of deaths was for Black, non-Hispanic people. 59.5% of their deaths due to police violence were misreported. However, rates were above 50% for White, non-Hispanic people too.
- Deaths due to police violence declined for most groups of people from 1980 to 1990 but have remained relatively constant since then.
- The rate of police killings for non-Hispanic Black people is about 3.5 times higher than the rate for non-Hispanic White people.
We wrote a post summarizing the study’s data and findings and really encourage you to read the original study and/or our summary of it — there are a lot of thought-provoking quotes and details covered. We wanted to highlight three of our takeaways from the study here:
- There are lots of avenues to improve the government’s data collection on deaths due to police involvement. Pushing on multiple avenues will probably be more effective than only pursuing one. Possible directions include pushing all states to participate in the National Violent Death Reporting System, including a checkbox for police involvement on death certificates, and establishing the independence of forensic pathologists from law enforcement.
- Without accurately documenting how often people are killed by police, we can’t understand if any police reforms work. This is also why, in policy evaluations, the biggest “negative externality” of policing – civilian deaths – is unaccounted for in almost all studies of “police effectiveness.”
- The study could be extended in lots of useful ways, including by estimating the degree of underreporting in specific counties and cities over time. This might open up more avenues for individuals and groups to hold our local officials (coroners, medical examiners, and police and court officials) accountable for being accurate and honest in deaths due to police involvement.
Applications are open for Strategic Data Project fellows and partnership organizations
I really enjoy working with the Strategic Data Project (SDP) at the Center for Education Policy Research at Harvard — which is why I want to encourage you or your organization to consider applying for the next cohort!
For fellows, SDP is a two-year program in which candidates become full-time employees of educational organizations for two years, working on key analytic projects for their org with training and support from SDP (including me!). SDP now offers both PK-12 and higher education placements — I’m excited about SDP’s recent expansion into higher ed because I think the sector is ripe for a lot of the collaboration and sharing of resources and processes that SDP encourages. SDP is also seeking partner organizations at all levels of education.
In the last couple weeks, I presented sessions to the PK-12 Cohort 12 fellows on predictive analytics and data visualization and to the SDP Higher Education fellows on Data Governance.
If you or your organization might be interested in joining SDP, sign up for an upcoming informational webinar at sdp.cepr.harvard.edu/calendar/upcoming or check out the application.
What we’re reading and thinking about:
New Report Highlights Milwaukee’s Police Pension Problem
The City of Milwaukee is on its way to becoming a police department and not much else. This new report from The African American Round Table is an honest accounting of that fiscal reality. @LiberateMke is one of the only voices putting solutions on the table and we always learn from them when we get a chance to contribute to their work.
Economics was not one of the original Nobel prizes. The creation by a bank of an Economics Nobel Prize was an all-time brilliant marketing move. I’ve complained about this before, but this article captures the problem of branding economics as “more empirical” and superior to other social sciences. Economics has contributed a lot to our understanding of the social world, but the hubris it brings has also led to many damaging mistakes.
When Kidney Donation Goes Viral
One of my absolute favorite reads is Rajiv Sethi – an economics professor who does not shy away from the moral and human in analysis of difficult topics. I learned a lot about the dynamics of organ donation from this piece plus a little bit about that whole “Bad Art Friend” thing too.
It was amazing when Florida voters overwhelmingly voted in favor of restoring voting rights to people who had served their court-mandated sentences. But unfortunately that was just another step in the long struggle to maintain the right to vote. Now people are being forced to repay the dizzying (and absurd) fines and fees accumulated while in the criminal justice system before being able to vote. This article captures the unfairness of it, including a case of someone who would have to pay $50,000 to vote.
Fast Company Recognizes the Racial Equity Data Hub
I was really pleased to see the Racial Equity Data Hub project from the Tableau Foundation featured in this roundup of projects lauded for their innovation in design for social good. A lot of the recognized projects looked really inspiring so check it out!
And finally, something positive and close to my heart:
Skateparks and the Real Montana
News coverage of my home state of Montana tends to focus on tourist-friendly vacation spots or the lives of the rich and famous. This photo essay is different. It depicts Jeff Ament’s (bassist of a little band called Pearl Jam) effort to bring skateparks to as many towns big and small across the state as possible. Along the way you’ll get a sense of a Montana that is much more familiar to me. Highly recommend.