

This is a repost of my newsletter, The Civic Pulse, which I am crossposting to the blog. If you like the newsletter, subscribe here: https://civilytics.substack.com/welcome
In this edition of the Civic Pulse you’ll find:
- Effective ways to use local ARPA aid
- The geography of policing and how it impedes change
- Grassroots reports on policing that Civilytics contributed to
- Efforts to use community data to identify barriers to student engagement
- A roundup of what we’re reading
Effective ways to spend your ARPA aid
Following up on our story last issue about the magnitude of the transformative federal aid to state and local governments, we wanted to share an exciting new resource that outlines ways to use ARPA aid to build resiliency and safety in your community. ARPA aid is very different from CARES aid (the prior pandemic aid package), and is much less restrictive. Being thoughtful and creative in deploying it is one of the biggest policy challenges facing local decision-makers.
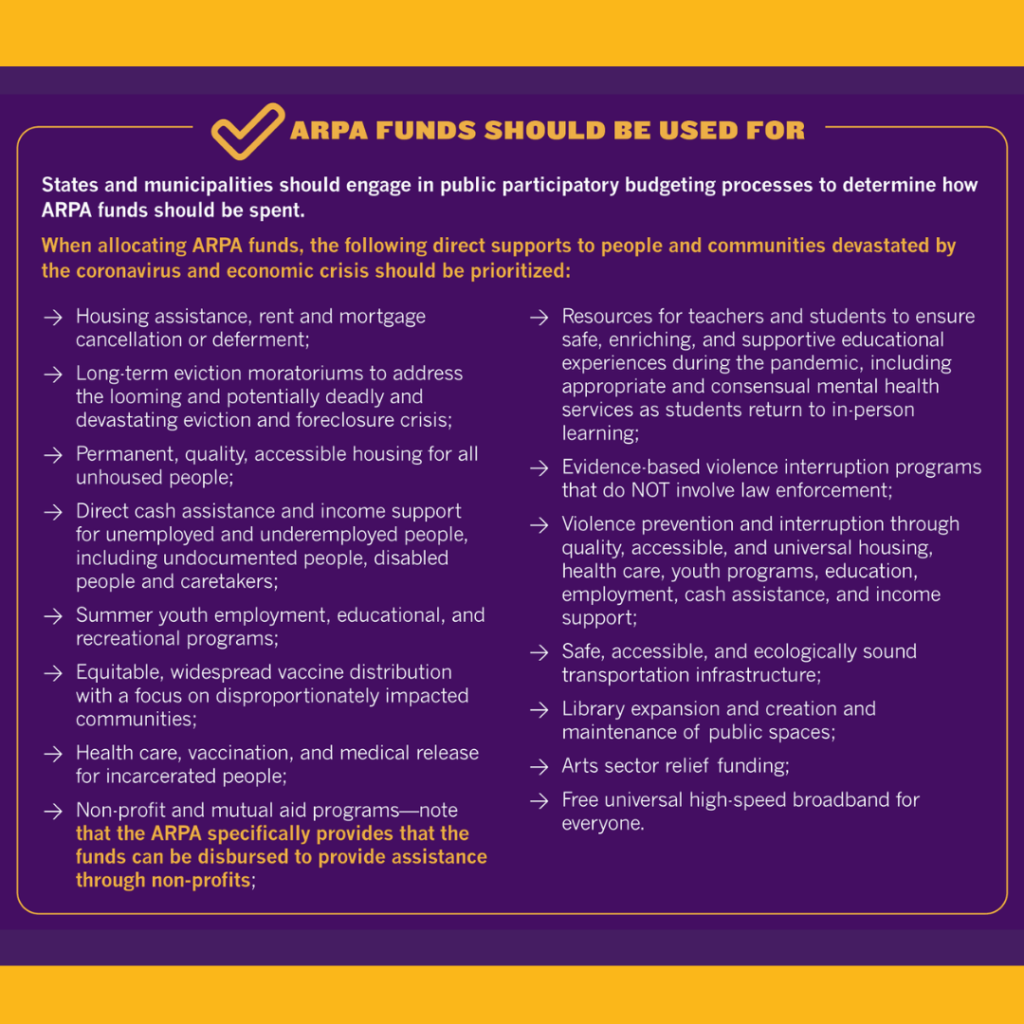
Our own Dr. Hannah Miller also wrote an in-depth review of 5 creative ways your community could deploy its upcoming ARPA aid to meet the moment.
- Give essential workers a raise
- Pay the rent
- Support your schools (the LeBron way)
- Eliminate water debt
- Provide grief and trauma counseling
Read her excellent write-up for these ideas which include examples of programs in place that your city could copy and use today. In most places ARPA aid will be enough to fund multiple ideas so it’s time to get creative.
Also, check out how much rent debt is impacting your community with this new resource from PolicyLink:
The geography of policing
Editor’s Note: Everything below was written before the Columbus Police Department shot and killed Ma’Khia Bryant, a teenage girl, less than an hour before the guilty verdict was announced in the trial of Derek Chauvin. The death of Ms. Bryant, who was in foster care, is a terrible tragedy and an indictment of the systems we put in place to control and criminalize instead of to protect and uplift families, particularly Black families.
It was also written before the tragic killing of Daunte Wright by the Brooklyn Center Police Department outside of Minneapolis, MN.
The point illustrated is all the more relevant – Black people have to exist everywhere in America, not just in major cities that are the sites of active campaigns to rethink policing. The project of unknotting the harmful and racist institutional features of policing from our communities will not be finished until it is done in every county, city, village, and town.
I want to give you a little peek behind the scenes at some of the longer-term work we’re doing at Civilytics. We’ve been working for a while on building a geo-referenced cross-discipline data system to enable high-quality, rigorous descriptive analyses of local conditions. The key question that sparked me to set out on this work was “How many people from how many different jurisdictions could legally pull me over on a typical commute?” Of course, I don’t actually commute anywhere but…
The U.S. has averaged about 2 to 2.5 police officers per 1,000 people for the past 10 years.
This means that, for a city of 100,000, you could expert a police force with between 200 and 250 officers. Hidden in that average is a lot of variation. And that variation can be accounted for by a lot of factors, one of the most important being the racial makeup of the community.
But what is also striking is that, in a city of 100,000 people, plenty of people live in independent municipalities outside of the city boundaries. And in many cases these small towns also have a police force. And so might the local university. And the state highway. So while I live, vote, and pay taxes in the town of 100,000 and my police department is nominally accountable to the leadership of that city, I can still be pulled over and arrested, searched, detained, or served a warrant by an array of police forces who are not accountable to me or the local officials I elect.
This may sound theoretical so let’s look at Columbus, Ohio. Using the FBI’s Crime Data Explorer API, we can get a list of every currently operating police department within a 10 mile radius of the center of Columbus, a distance we might cover running some local errands and visiting family and friends across the metro area.
On our Saturday drive around the Columbus metro area, we could cross into the jurisdiction of no less than 28 unique law enforcement agencies:
- 21 municipal police departments
- The Franklin County Sheriff’s Office
- The Ohio State Highway Patrol
- The Ohio State University – Columbus Police Department
- The Columbus State Community College Police Force
- The Port Columbus International Airport Police
- The Ohio State Investigative Unit and Department of Natural Resources (yes, they’re law enforcement)
Not all of these law enforcement agencies report employment data annually to the FBI, but for those that do (~ 2 out of 3), the officers per 1,000 residents ranges from under 1 to over 9 with the median being right in line with the national ratio of 2.1. That is a lot of variation in this small region!
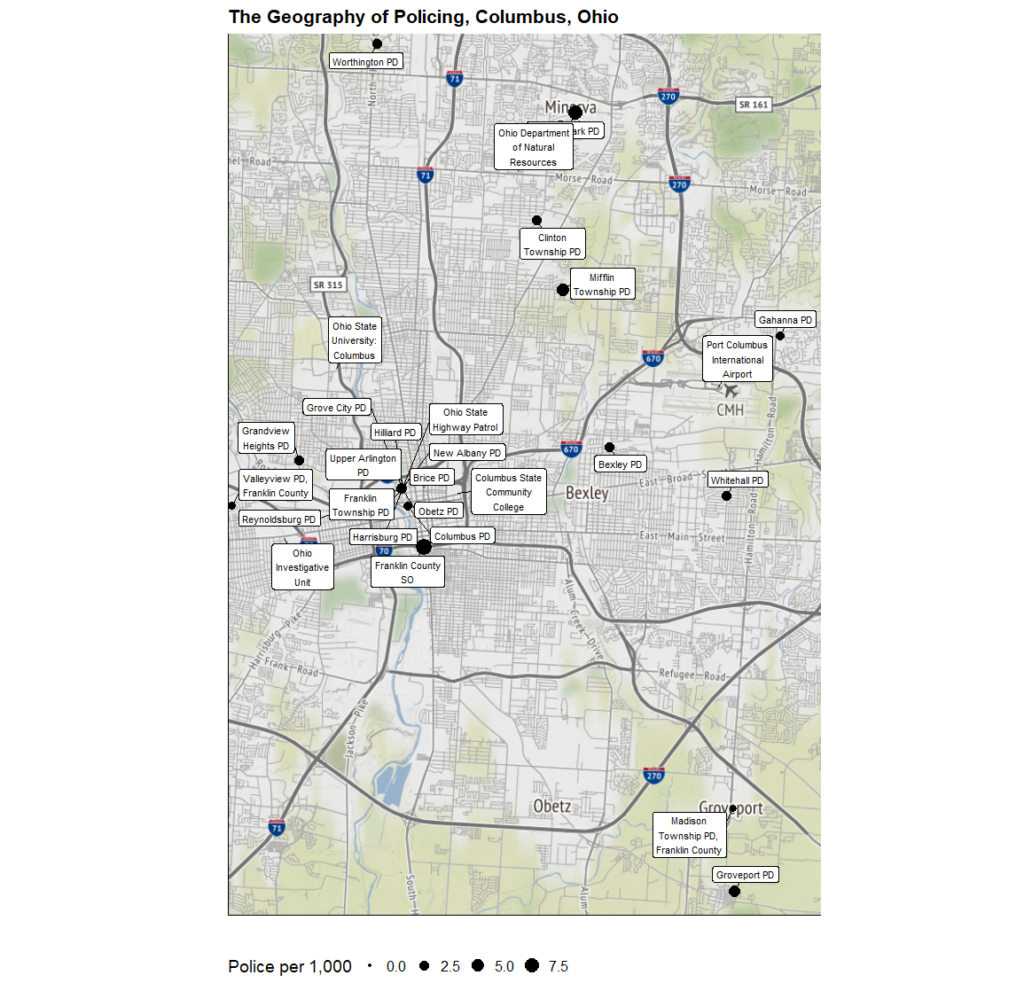
There are thousands of police officers working in the Columbus metro area every day. As you move across the metro area, you move through the jurisdiction and authority of hundreds of officers who have no line of accountability to you. You cannot influence their policies or procedures, budgets, or staffing levels. But they can search your vehicle or person and put you in custody, or kill you.
In December of 2020, police from two different police departments in the Columbus metro area shot and killed black men who were just going about their daily lives.
- First, Casey Christopher Goodson, was shot and killed by a Franklin County Sheriff’s deputy, when he was returning home after getting Subway for his family.
- Then Andre Maurice Hill was shot and killed by a Columbus Police Department officer in his friend’s garage while holding a cell phone.
There may be some political pressure on those two departments to reform or become more accountable, but 20+ other police departments in the region are isolated from those efforts due to the local control that communities have over policing.
Throughout the year we’ll be working on ways to describe and illustrate how changing policing is an incredibly serious game of whack a mole. We hope very soon for you to be able to explore how many police departments and which ones you would pass through on any point-to-point route in the U.S. and how the number of police officers employed varies by the race of each community and its neighbors.
Civilytics contributes to APTP and Poder in Action reports
In response to this summer’s nationwide protests demanding new approaches to community safety, many cities are creating community task forces to identify priorities to reform their police forces. Like all local political efforts, the influence of these task forces and how democratically they operate depends a lot on who receives an invitation to the table and what the ground rules are.
In Oakland and Phoenix, grassroots organizations have taken the initiative and issued their own detailed research reports with proposed changes to how their city provides public safety. These are creative, bold, visionary documents that are worth your time.
In addition to being great examples of participatory research in action, these reports present a detailed and thorough account of what policing and safety looks like in America’s cities. Civilytics is happy to have contributed some research and analysis to each of these reports, such as the map below.
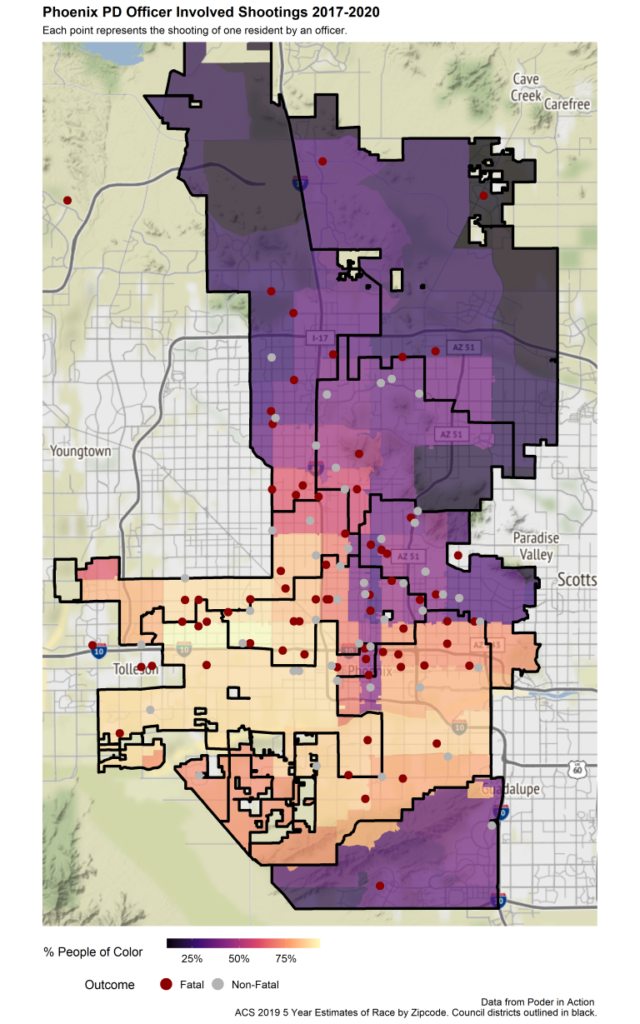
Read Poder in Action’s report for Phoenix. https://www.poderinaction.org/community-research-report
Read the Anti Police-Terror Project’s report for Oakland. https://www.antipoliceterrorproject.org/oakland-is-ready-to-reimagine-public-safety
America’s cities are spending far too much money chasing criminal offenders after the fact and manufacturing criminal charges through drug enforcement. Real safety strategies like housing, economic stability, and childcare are much more affordable and proven to work.
Presenting to The National Student Engagement and Attendance Center
I serve as a subject matter expert for the Student Engagement and Attendance Center (SEAC) which supports states and districts in efforts to reduce chronic absenteeism and increase student engagement.
Recently, I had the pleasure of speaking to a group of state and local education agency staff about the benefits of integrating aggregate data from content areas outside of education with education data systems. We all know that students’ experiences are affected by a whole host of factors outside the education system. Existing, publicly available data on community contexts can help identify and then begin to address some structural barriers to student engagement and success.
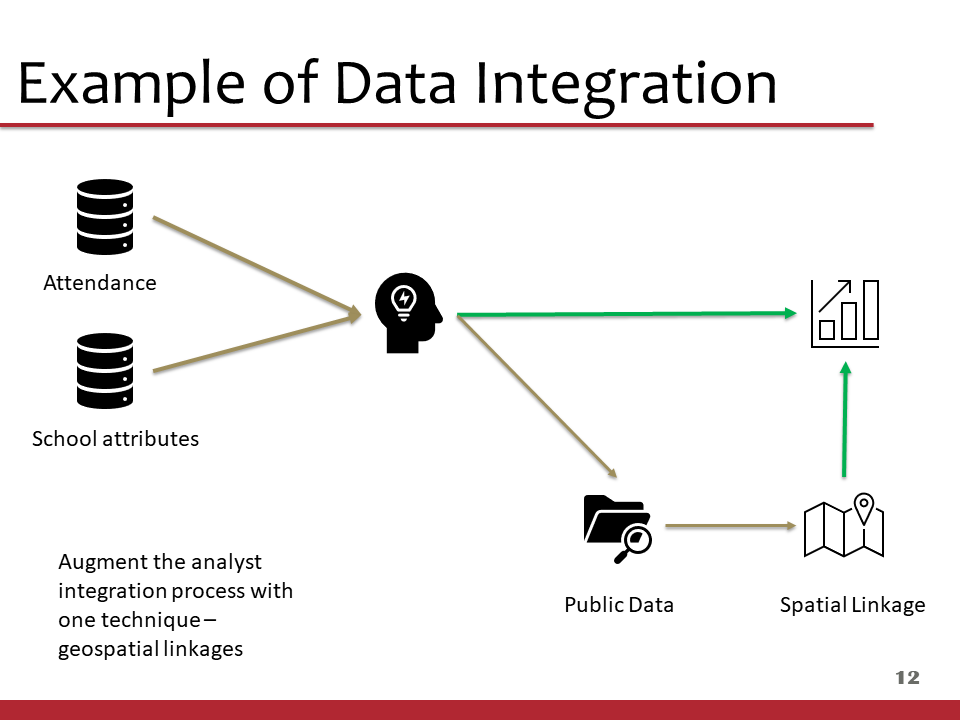
Since my days working on cutting up ACS estimates into school district boundaries for the Wisconsin Department of Public Instruction (in the days before ACS-ED maps, https://nces.ed.gov/programs/maped), I’ve championed the benefits of bringing rich and granular education data together with publicly available community data to provide context for education decisions.
I co-presented for the SEAC with Roland Richard, the Director of Data Analytics at Gwinnett County Public Schools outside of Atlanta. He’s one of the best R programmers I know and worked on a really innovative application of this concept by using a basket of Census measures to create a community context index to better understand the needs of families served by schools in the Atlanta region.
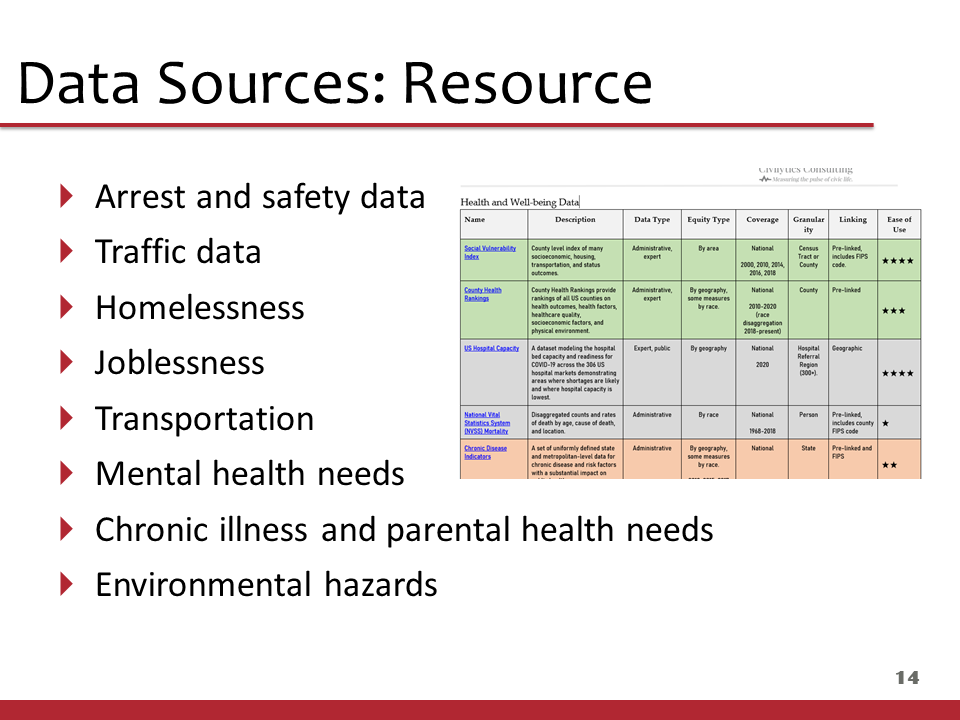
I am hoping to see school data systems integrate a wider variety of data sources, like some of those below, to understand and plan for community needs.
What we’re reading
On Derek Chauvin, movements, and where we go next
Harold Myerson at The Prospect says it better than anything I can.
Water utilities are being privatized and purchased around the country.
A water bill that looks like my internet bill? No thanks…
I have been reflecting on the COVID-19 pandemic with these sobering numbers on the eve of my first vaccine dose.
A data visualization visionary from 1900, what can’t DuBois do?
Data viz in 1900, shockingly modern visualizations of racial inequality from W.E.B. DuBois and his team.
Prison gerrymandering in the New York Times.
Census releases are going to start coming out and we cannot lose sight of this administrative decision that can help restore Black political power:
A great new resource on how to measure civic readiness in communities
More and more we’re realizing that it may be more important for students to learn how to be informed democratic participants than to memorize the periodic table or learn what a derivative is. This new resource looks like a good help.
As always, we appreciate your help spreading the word about this newsletter. If you haven’t already, please subscribe.
We love to hear from you! If you’ve got a project you think Civilytics can help with or a question, do get in touch.
With gratitude,
Jared