
Update: Treasury has published official population figures for non-metropolitan cities (non-entitlement units). The aid calculator for cities has been updated to reflect the new list of non-entitlement units and their populations. Read our analysis of the impact of these changes.
June 3, 2021
Update: The official aid figures have been published by Treasury for all state, Tribal, territorial, county, and metropolitan cities. Non-metropolitan city estimates have not been published.
May 10, 2021
Update: Looking for effective and creative uses of ARPA aid to make your community better? Read our explainer and share your ideas with us. We’ll keep more updates coming as we have them.
The American Rescue Plan Act (ARPA) was signed into law by President Biden on March 11, 2021. ARPA provides $1.9 trillion in economic relief through direct payments (stimulus checks), expanded child tax credits and unemployment benefits, small business loans, and aid to local and state governments.
ARPA allocates $350 billion in aid for state and local governments. This is in addition to the aid previously allocated under prior coronavirus relief efforts (the CARES Act and the Coronavirus Response and Relief Supplemental Appropriations Act). Unlike aid in the previous supplemental act, aid in ARPA is largely unrestricted.
How can the funds be used?
Both state and local governments are required to submit to Treasury a certification from the governor or other authorized officer of the state attesting that the state, or local government, needs federal assistance for the purposes below.
- Respond to the COVID-19 pandemic by addressing its economic effects, including aid to households, small businesses, nonprofits, and industries such as tourism and hospitality;
- Provide premium pay to essential employees or grants to their employers. Premium pay cannot exceed $13 per hour or $25,000 per worker extra;
- Provide government services affected by a revenue reduction resulting from COVID-19; and/or
- Make necessary investments in water, sewer and broadband infrastructure.
How much is the funding?
- Counties will receive about $195 per resident
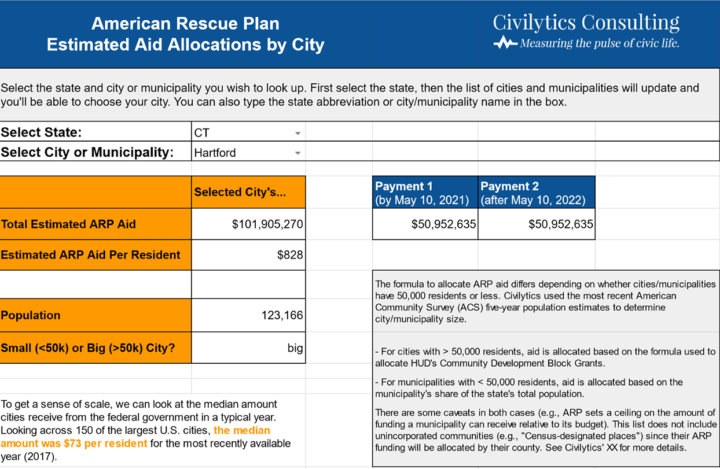
- Larger cities (approx. 50,000 residents or more) will receive an average of $200 to $300 per resident (the funding formula for this category takes into account city need)
- Smaller municipalities will receive ~$104 per resident
For comparison, in a typical year, the federal government disburses about $250 per resident in aid to all local governments serving that resident (e.g., city, county), not including federal pass-through education aid. ARPA aid more than doubles that amount (“Fiscally Standardized Cities” 2017; Chernick, Copeland, and Reschovsky 2020).*
When will the funds come?
Half the funds will be paid by May 10. The other half will be paid no sooner than 12 months later (May 10, 2022).
ARPA Aid Allocations for 200 Largest Cities
Use the table below to look up the aid allocations for your city. Remember the aid amount below will come in two payments. If your city is not listed here, you can find the full aid allocations or estimates for all municipalities in the U.S. below.
| City | State | Treasury Allocation | Aid Per Resident | Population |
|---|---|---|---|---|
| New York | New York | $4,259,566,740 | $511 | 8,336,817 |
| Los Angeles | California | $1,278,900,928 | $321 | 3,979,576 |
| Chicago | Illinois | $1,886,591,388 | $700 | 2,693,976 |
| Houston | Texas | $607,769,139 | $262 | 2,320,268 |
| Phoenix | Arizona | $396,080,366 | $236 | 1,680,992 |
| Philadelphia | Pennsylvania | $1,087,606,822 | $687 | 1,584,064 |
| San Antonio | Texas | $326,919,408 | $211 | 1,547,253 |
| San Diego | California | $299,714,755 | $210 | 1,423,851 |
| Dallas | Texas | $355,426,891 | $265 | 1,343,573 |
| San Jose | California | $212,280,152 | $208 | 1,021,795 |
| Austin | Texas | $188,482,478 | $193 | 978,908 |
| Jacksonville city | Florida | $157,663,110 | $173 | 911,507 |
| Fort Worth | Texas | $173,745,090 | $191 | 909,585 |
| Columbus | Ohio | $187,030,138 | $208 | 898,553 |
| Charlotte | North Carolina | $141,618,325 | $160 | 885,708 |
| San Francisco | California | $453,586,783 | $515 | 881,549 |
| Indianapolis | Indiana | $232,410,707 | $265 | 876,384 |
| Seattle | Washington | $232,341,627 | $308 | 753,675 |
| Denver | Colorado | $166,796,658 | $229 | 727,211 |
| District Of Columbia | District of Columbia | $372,859,344 | $528 | 705,749 |
| Boston | Massachusetts | $424,179,607 | $612 | 692,600 |
| El Paso | Texas | $154,345,135 | $226 | 681,728 |
| Nashville-Davidson | Tennessee | $124,981,265 | $186 | 670,820 |
| Detroit | Michigan | $826,675,290 | $1,234 | 670,031 |
| Oklahoma City | Oklahoma | $122,507,590 | $187 | 655,057 |
| Portland | Oregon | $207,895,373 | $318 | 654,741 |
| Las Vegas | Nevada | $130,568,739 | $200 | 651,319 |
| Memphis | Tennessee | $161,061,490 | $247 | 651,073 |
| Louisville-Jefferson County | Kentucky | $239,362,213 | $388 | 617,638 |
| Baltimore | Maryland | $525,891,651 | $886 | 593,490 |
| Milwaukee | Wisconsin | $394,226,649 | $668 | 590,157 |
| Albuquerque | New Mexico | $108,810,857 | $194 | 560,513 |
| Tucson | Arizona | $135,696,763 | $248 | 548,073 |
| Fresno | California | $170,808,029 | $321 | 531,576 |
| Mesa | Arizona | $105,515,724 | $204 | 518,012 |
| Sacramento | California | $112,313,331 | $219 | 513,624 |
| Atlanta | Georgia | $170,928,821 | $337 | 506,811 |
| Kansas City | Missouri | $194,776,376 | $393 | 495,327 |
| Brookhaven Town | New York | $55,026,837 | $114 | 480,763 |
| Colorado Springs | Colorado | $76,039,132 | $159 | 478,221 |
| Omaha | Nebraska | $112,591,455 | $235 | 478,192 |
| Raleigh | North Carolina | $73,292,365 | $155 | 474,069 |
| Miami | Florida | $137,639,417 | $294 | 467,963 |
| Long Beach | California | $135,753,078 | $293 | 462,628 |
| Virginia Beach | Virginia | $49,027,529 | $109 | 449,974 |
| Oakland | California | $188,081,700 | $434 | 433,031 |
| Minneapolis | Minnesota | $271,192,484 | $631 | 429,606 |
| Tulsa | Oklahoma | $87,826,517 | $219 | 401,190 |
| Tampa | Florida | $80,373,543 | $201 | 399,700 |
| Arlington | Texas | $81,498,709 | $204 | 398,854 |
| New Orleans | Louisiana | $311,742,151 | $799 | 390,144 |
| Wichita | Kansas | $72,422,555 | $186 | 389,938 |
| Bakersfield | California | $94,517,089 | $246 | 384,145 |
| Cleveland | Ohio | $511,721,590 | $1,343 | 381,009 |
| Aurora | Colorado | $65,424,806 | $172 | 379,289 |
| Anaheim | California | $106,630,239 | $304 | 350,365 |
| Honolulu | Hawaii | $196,954,703 | $571 | 345,064 |
| Santa Ana | California | $128,360,813 | $386 | 332,318 |
| Riverside | California | $73,535,189 | $222 | 331,360 |
| Islip Town | New York | $47,551,642 | $144 | 329,610 |
| Corpus Christi | Texas | $67,553,894 | $207 | 326,586 |
| Lexington-Fayette | Kentucky | $58,409,570 | $181 | 323,152 |
| Henderson | Nevada | $37,368,428 | $117 | 320,189 |
| San Juan Municipio | Puerto Rico | $175,854,727 | $552 | 318,441 |
| Stockton | California | $78,052,072 | $250 | 312,697 |
| St Paul | Minnesota | $166,641,623 | $541 | 308,096 |
| Cincinnati | Ohio | $279,590,123 | $920 | 303,940 |
| St Louis | Missouri | $439,692,690 | $1,463 | 300,576 |
| Pittsburgh | Pennsylvania | $335,070,222 | $1,116 | 300,286 |
| Greensboro | North Carolina | $59,430,051 | $200 | 296,710 |
| Lincoln | Nebraska | $45,949,074 | $159 | 289,102 |
| Anchorage | Alaska | $47,376,742 | $165 | 288,000 |
| Plano | Texas | $36,424,316 | $127 | 287,677 |
| Orlando | Florida | $58,032,405 | $202 | 287,442 |
| Irvine | California | $56,433,217 | $196 | 287,401 |
| Newark | New Jersey | $176,667,606 | $626 | 282,011 |
| Durham | North Carolina | $51,881,733 | $186 | 278,993 |
| Chula Vista | California | $57,535,251 | $210 | 274,492 |
| Toledo | Ohio | $180,948,591 | $663 | 272,779 |
| Fort Wayne | Indiana | $50,815,327 | $188 | 270,402 |
| St Petersburg | Florida | $45,413,871 | $171 | 265,351 |
| Laredo | Texas | $85,558,888 | $326 | 262,491 |
| Jersey City | New Jersey | $139,971,935 | $534 | 262,075 |
| Chandler | Arizona | $34,560,795 | $132 | 261,165 |
| Madison | Wisconsin | $47,197,155 | $182 | 259,680 |
| Lubbock | Texas | $56,575,324 | $219 | 258,862 |
| Scottsdale | Arizona | $29,244,706 | $113 | 258,069 |
| Reno | Nevada | $51,519,997 | $202 | 255,601 |
| Buffalo | New York | $331,356,932 | $1,298 | 255,284 |
| Gilbert | Arizona | $24,159,871 | $95 | 254,114 |
| Glendale | Arizona | $59,516,611 | $236 | 252,381 |
| North Las Vegas | Nevada | $46,340,548 | $184 | 251,974 |
| Winston-Salem | North Carolina | $51,732,065 | $209 | 247,945 |
| Chesapeake | Virginia | $28,469,568 | $116 | 244,835 |
| Norfolk | Virginia | $106,991,262 | $441 | 242,742 |
| Fremont | California | $44,211,563 | $183 | 241,110 |
| Garland | Texas | $53,513,994 | $223 | 239,928 |
| Irving | Texas | $54,277,494 | $226 | 239,798 |
| Hialeah | Florida | $66,834,253 | $286 | 233,339 |
| Richmond | Virginia | $110,120,336 | $478 | 230,436 |
| Boise | Idaho | $36,904,682 | $161 | 228,959 |
| Spokane | Washington | $80,991,104 | $365 | 222,081 |
| Baton Rouge | Louisiana | $79,966,896 | $363 | 220,236 |
| Tacoma | Washington | $60,969,952 | $280 | 217,827 |
| San Bernardino | California | $77,656,407 | $360 | 215,784 |
| Modesto | California | $45,897,056 | $213 | 215,196 |
| Fontana | California | $50,257,113 | $234 | 214,547 |
| Des Moines | Iowa | $94,824,614 | $443 | 214,237 |
| Moreno Valley | California | $48,481,233 | $228 | 213,055 |
| Santa Clarita | California | $35,148,685 | $165 | 212,979 |
| Fayetteville | North Carolina | $40,427,539 | $191 | 211,657 |
| Babylon Town | New York | $27,770,292 | $132 | 210,141 |
| Birmingham | Alabama | $141,272,354 | $675 | 209,403 |
| Oxnard | California | $59,540,662 | $285 | 208,881 |
| Rochester | New York | $202,141,319 | $983 | 205,695 |
| Port St Lucie | Florida | $24,739,425 | $123 | 201,846 |
| Grand Rapids | Michigan | $92,279,500 | $459 | 201,013 |
| Huntsville | Alabama | $34,402,593 | $172 | 200,574 |
| Salt Lake City | Utah | $85,411,572 | $426 | 200,567 |
| Huntington Town | New York | $22,209,010 | $111 | 200,503 |
| Frisco | Texas | $16,638,254 | $83 | 200,490 |
| Yonkers | New York | $87,486,480 | $437 | 200,370 |
| Amarillo | Texas | $39,676,317 | $199 | 199,371 |
| Glendale | California | $43,521,005 | $218 | 199,303 |
| Huntington Beach | California | $29,606,925 | $149 | 199,223 |
| Mckinney City | Texas | $23,115,761 | $116 | 199,177 |
| Montgomery | Alabama | $41,639,442 | $210 | 198,525 |
| Augusta-Richmond County | Georgia | $43,012,121 | $217 | 197,888 |
| Aurora | Illinois | $35,221,280 | $178 | 197,757 |
| Akron | Ohio | $145,337,626 | $736 | 197,597 |
| Little Rock | Arkansas | $37,713,401 | $191 | 197,312 |
| Tempe | Arizona | $45,869,312 | $234 | 195,805 |
| Columbus-Muscogee County | Georgia | $40,456,205 | $207 | 195,769 |
| Overland Park | Kansas | $18,581,302 | $95 | 195,494 |
| Grand Prairie | Texas | $36,709,655 | $189 | 194,543 |
| Tallahassee | Florida | $46,468,128 | $239 | 194,500 |
| Cape Coral | Florida | $25,439,699 | $131 | 194,495 |
| Mobile | Alabama | $58,203,265 | $308 | 188,720 |
| Knoxville | Tennessee | $42,453,411 | $226 | 187,603 |
| Shreveport | Louisiana | $48,240,338 | $258 | 187,112 |
| Worcester | Massachusetts | $110,617,389 | $597 | 185,428 |
| Ontario | California | $45,609,291 | $247 | 185,010 |
| Vancouver | Washington | $33,135,869 | $180 | 184,463 |
| Sioux Falls | South Dakota | $25,415,071 | $138 | 183,793 |
| Chattanooga | Tennessee | $38,640,506 | $211 | 182,799 |
| Brownsville | Texas | $65,194,854 | $357 | 182,781 |
| Ft Lauderdale | Florida | $38,133,766 | $209 | 182,437 |
| Providence | Rhode Island | $131,373,965 | $730 | 179,883 |
| Newport News | Virginia | $31,981,891 | $178 | 179,225 |
| Rancho Cucamonga | California | $26,835,530 | $151 | 177,603 |
| Santa Rosa | California | $34,637,465 | $196 | 176,753 |
| Peoria City | Arizona | $20,769,706 | $118 | 175,961 |
| Oceanside | California | $32,346,514 | $184 | 175,742 |
| Elk Grove | California | $21,944,605 | $126 | 174,775 |
| Salem | Oregon | $34,127,916 | $196 | 174,365 |
| Pembroke Pines | Florida | $25,463,361 | $147 | 173,591 |
| Eugene | Oregon | $35,908,037 | $208 | 172,622 |
| Garden Grove | California | $48,374,570 | $282 | 171,644 |
| Cary | North Carolina | $16,476,072 | $97 | 170,282 |
| Fort Collins | Colorado | $28,118,971 | $165 | 170,243 |
| Corona | California | $29,158,725 | $172 | 169,868 |
| Bayamon Municipio | Puerto Rico | $53,127,043 | $314 | 169,269 |
| Springfield | Missouri | $40,276,290 | $240 | 167,882 |
| Jackson | Mississippi | $42,098,330 | $262 | 160,628 |
| Alexandria | Virginia | $28,666,813 | $180 | 159,428 |
| Hayward | California | $38,465,994 | $242 | 159,203 |
| Clarksville | Tennessee | $25,531,478 | $161 | 158,146 |
| Lakewood | Colorado | $21,581,066 | $137 | 157,935 |
| Lancaster | California | $36,340,561 | $231 | 157,601 |
| Salinas | California | $51,567,313 | $332 | 155,465 |
| Palmdale | California | $35,445,019 | $229 | 155,079 |
| Hollywood | Florida | $29,390,502 | $190 | 154,817 |
| Springfield | Massachusetts | $93,848,687 | $611 | 153,606 |
| Macon-Bibb County | Georgia | $46,115,570 | $301 | 153,159 |
| Kansas City | Kansas | $55,383,872 | $362 | 152,960 |
| Sunnyvale | California | $28,154,030 | $184 | 152,703 |
| Pomona | California | $45,366,413 | $299 | 151,691 |
| Killeen | Texas | $29,117,907 | $192 | 151,666 |
| Escondido | California | $38,808,509 | $256 | 151,625 |
| Pasadena | Texas | $40,199,596 | $266 | 151,227 |
| Naperville | Illinois | $13,308,689 | $90 | 148,449 |
| Bellevue | Washington | $20,110,630 | $136 | 148,164 |
| Hoffman Estates | Illinois | $5,634,310 | $38 | 147,344 |
| Joliet | Illinois | $22,207,675 | $151 | 147,344 |
| Carolina Municipio | Puerto Rico | $43,674,914 | $297 | 146,984 |
| Murfreesboro | Tennessee | $24,106,035 | $164 | 146,900 |
| Midland | Texas | $24,988,224 | $171 | 146,038 |
| Rockford | Illinois | $54,822,355 | $377 | 145,609 |
| Paterson | New Jersey | $64,668,166 | $445 | 145,233 |
| Savannah | Georgia | $55,591,247 | $385 | 144,464 |
| Bridgeport | Connecticut | $82,662,800 | $572 | 144,399 |
| Torrance | California | $24,074,277 | $168 | 143,592 |
| Mc Allen | Texas | $41,922,103 | $293 | 143,268 |
| Syracuse | New York | $123,076,929 | $865 | 142,327 |
| Surprise City | Arizona | $15,545,984 | $110 | 141,664 |
| Denton | Texas | $23,290,438 | $165 | 141,541 |
| Roseville | California | $17,644,859 | $125 | 141,500 |
| Thornton | Colorado | $21,001,371 | $148 | 141,464 |
| Miramar | Florida | $22,053,169 | $156 | 141,191 |
| Pasadena | California | $52,625,975 | $373 | 141,029 |
ARPA Aid Estimates for 200 Largest Counties
Use the table below to look up the aid allocations for your county. Remember the aid amount below will come in two payments. If your county is not listed here, you can find the full aid allocations for all counties in the U.S. below.
| County | State | Treasury Allocation | Estimated Per Resident | Estimated Population |
|---|---|---|---|---|
| Los Angeles County | CA | $1,949,978,847 | $193 | 10,081,570 |
| Cook County | IL | $1,000,372,385 | $192 | 5,198,275 |
| Harris County | TX | $915,508,128 | $197 | 4,646,630 |
| Maricopa County | AZ | $871,239,088 | $201 | 4,328,810 |
| San Diego County | CA | $648,431,468 | $196 | 3,316,073 |
| Orange County | CA | $616,840,943 | $195 | 3,168,044 |
| Miami-Dade County | FL | $527,733,745 | $195 | 2,699,428 |
| Dallas County | TX | $511,918,088 | $196 | 2,606,868 |
| Kings County | NY | $497,231,149 | $192 | 2,589,974 |
| Riverside County | CA | $479,874,599 | $199 | 2,411,439 |
| Queens County | NY | $437,785,496 | $191 | 2,287,388 |
| King County | WA | $437,576,495 | $199 | 2,195,502 |
| Clark County | NV | $440,282,817 | $202 | 2,182,004 |
| San Bernardino County | CA | $423,455,955 | $197 | 2,149,031 |
| Tarrant County | TX | $408,388,891 | $199 | 2,049,770 |
| Bexar County | TX | $389,166,877 | $199 | 1,952,843 |
| Santa Clara County | CA | $374,462,651 | $194 | 1,927,470 |
| Broward County | FL | $379,304,234 | $197 | 1,926,205 |
| Wayne County | MI | $339,789,370 | $193 | 1,757,299 |
| Alameda County | CA | $324,636,065 | $196 | 1,656,754 |
| New York County | NY | $316,357,047 | $194 | 1,631,993 |
| Middlesex County | MA | $313,053,637 | $196 | 1,600,842 |
| Philadelphia County | PA | $307,685,862 | $195 | 1,579,075 |
| Sacramento County | CA | $301,469,072 | $198 | 1,524,553 |
| Suffolk County | NY | $286,812,434 | $193 | 1,483,832 |
| Palm Beach County | FL | $290,730,026 | $198 | 1,465,027 |
| Bronx County | NY | $275,470,084 | $192 | 1,435,068 |
| HillsBorough County | FL | $285,912,528 | $201 | 1,422,278 |
| Nassau County | NY | $385,003,440 | $284 | 1,356,509 |
| Orange County | FL | $270,661,716 | $201 | 1,349,746 |
| Franklin County | OH | $255,764,417 | $198 | 1,290,360 |
| Oakland County | MI | $244,270,949 | $195 | 1,253,185 |
| Cuyahoga County | OH | $239,898,257 | $192 | 1,247,451 |
| Hennepin County | MN | $245,875,163 | $197 | 1,245,837 |
| Travis County | TX | $247,450,630 | $202 | 1,226,805 |
| Allegheny County | PA | $380,998,452 | $312 | 1,221,744 |
| Fairfax County | VA | $222,894,638 | $195 | 1,145,862 |
| Contra Costa County | CA | $224,058,903 | $196 | 1,142,251 |
| Salt Lake County | UT | $225,401,283 | $199 | 1,133,646 |
| Mecklenburg County | NC | $215,673,636 | $201 | 1,074,475 |
| Wake County | NC | $215,946,541 | $202 | 1,069,079 |
| Montgomery County | MD | $204,083,827 | $196 | 1,043,530 |
| Fulton County | GA | $206,657,290 | $199 | 1,036,200 |
| Pima County | AZ | $203,421,668 | $198 | 1,027,207 |
| St. Louis County | MO | $193,112,666 | $194 | 996,919 |
| Honolulu County | HI | $189,297,438 | $192 | 984,821 |
| Fresno County | CA | $194,063,657 | $197 | 984,521 |
| Collin County | TX | $200,984,172 | $206 | 973,977 |
| Westchester County | NY | $187,926,698 | $194 | 968,890 |
| Pinellas County | FL | $189,381,543 | $196 | 964,666 |
| Marion County | IN | $187,358,746 | $197 | 951,869 |
| Milwaukee County | WI | $183,696,189 | $193 | 951,226 |
| Fairfield County | CT | $183,231,182 | $194 | 943,926 |
| Shelby County | TN | $182,033,509 | $194 | 936,374 |
| Duval County | FL | $186,032,681 | $199 | 936,186 |
| Bergen County | NJ | $261,035,747 | $281 | 930,390 |
| DuPage County | IL | $179,266,585 | $193 | 929,060 |
| Erie County | NY | $178,447,094 | $194 | 919,355 |
| Gwinnett County | GA | $181,855,587 | $199 | 915,046 |
| Prince George's County | MD | $176,626,110 | $194 | 908,670 |
| Hartford County | CT | $173,206,156 | $194 | 893,561 |
| Kern County | CA | $174,853,685 | $197 | 887,641 |
| Pierce County | WA | $175,781,756 | $200 | 877,013 |
| San Francisco County | CA | $171,230,559 | $196 | 874,961 |
| Macomb County | MI | $169,758,815 | $195 | 870,325 |
| New Haven County | CT | $166,026,527 | $194 | 857,513 |
| Hidalgo County | TX | $212,973,405 | $249 | 855,176 |
| Ventura County | CA | $164,326,748 | $194 | 847,263 |
| El Paso County | TX | $163,012,143 | $195 | 836,062 |
| Denton County | TX | $172,329,559 | $207 | 833,822 |
| Baltimore County | MD | $160,706,923 | $194 | 828,018 |
| Middlesex County | NJ | $160,258,621 | $194 | 825,920 |
| Worcester County | MA | $161,338,586 | $196 | 824,772 |
| Montgomery County | PA | $161,395,498 | $196 | 823,823 |
| Hamilton County | OH | $158,784,547 | $195 | 813,589 |
| Multnomah County | OR | $157,887,555 | $196 | 804,606 |
| Snohomish County | WA | $159,679,985 | $200 | 798,808 |
| Suffolk County | MA | $156,149,511 | $196 | 796,605 |
| Essex County | NJ | $155,191,527 | $195 | 795,404 |
| Oklahoma County | OK | $154,892,206 | $197 | 787,216 |
| Essex County | MA | $153,260,605 | $196 | 783,676 |
| San Mateo County | CA | $148,897,819 | $194 | 767,423 |
| Jefferson County | KY | $148,933,559 | $194 | 767,419 |
| Fort Bend County | TX | $157,660,879 | $206 | 765,394 |
| Cobb County | GA | $147,648,478 | $197 | 751,218 |
| DeKalb County | GA | $147,484,541 | $197 | 749,323 |
| Monroe County | NY | $144,080,127 | $194 | 743,341 |
| San Joaquin County | CA | $148,038,314 | $199 | 742,603 |
| Lee County | FL | $149,675,549 | $203 | 737,468 |
| Denver County | CO | $141,252,212 | $200 | 705,576 |
| Lake County | IL | $135,293,758 | $193 | 701,473 |
| Norfolk County | MA | $137,282,758 | $196 | 700,437 |
| El Paso County | CO | $139,929,837 | $200 | 698,974 |
| Jackson County | MO | $136,551,645 | $196 | 696,216 |
| District of Columbia | DC | $137,083,470 | $198 | 692,683 |
| Will County | IL | $134,168,730 | $195 | 689,315 |
| Davidson County | TN | $134,829,335 | $196 | 687,488 |
| Polk County | FL | $140,779,436 | $205 | 686,218 |
| Bernalillo County | NM | $131,911,293 | $195 | 677,858 |
| Hudson County | NJ | $130,604,069 | $195 | 670,046 |
| Jefferson County | AL | $127,920,085 | $194 | 659,680 |
| Kent County | MI | $127,605,807 | $197 | 648,121 |
| Tulsa County | OK | $126,556,338 | $196 | 646,419 |
| Arapahoe County | CO | $127,534,910 | $198 | 644,560 |
| Providence County | RI | $124,104,857 | $195 | 635,737 |
| Bucks County | PA | $122,034,082 | $195 | 626,806 |
| Monmouth County | NJ | $120,193,675 | $193 | 621,659 |
| Baltimore City | MD | $115,278,475 | $189 | 609,032 |
| Utah County | UT | $123,581,190 | $204 | 605,490 |
| Ocean County | NJ | $117,938,762 | $198 | 596,415 |
| Johnson County | KS | $117,009,332 | $198 | 591,506 |
| Washington County | OR | $116,852,194 | $198 | 589,481 |
| Brevard County | FL | $116,920,177 | $200 | 585,507 |
| Jefferson County | CO | $113,217,801 | $197 | 574,798 |
| Montgomery County | TX | $117,978,581 | $206 | 571,949 |
| Anne Arundel County | MD | $112,509,414 | $197 | 571,275 |
| Delaware County | PA | $110,083,961 | $195 | 564,554 |
| Bristol County | MA | $109,786,776 | $196 | 561,037 |
| Douglas County | NE | $110,973,572 | $198 | 560,617 |
| New Castle County | DE | $108,531,220 | $195 | 556,165 |
| Union County | NJ | $130,591,801 | $236 | 554,033 |
| Williamson County | TX | $114,707,609 | $209 | 547,604 |
| Ramsey County | MN | $106,893,403 | $196 | 544,442 |
| Stanislaus County | CA | $106,959,250 | $197 | 543,194 |
| Summit County | OH | $105,085,433 | $194 | 541,334 |
| Lancaster County | PA | $106,000,489 | $196 | 540,999 |
| Volusia County | FL | $107,468,931 | $200 | 536,487 |
| Dane County | WI | $106,189,095 | $198 | 536,078 |
| Montgomery County | OH | $103,273,967 | $194 | 531,670 |
| Kane County | IL | $103,413,041 | $195 | 531,376 |
| Guilford County | NC | $104,339,752 | $198 | 527,868 |
| Pasco County | FL | $107,597,711 | $205 | 524,602 |
| Chester County | PA | $101,972,959 | $196 | 519,560 |
| Plymouth County | MA | $101,237,378 | $196 | 515,303 |
| Sedgwick County | KS | $100,235,109 | $195 | 513,375 |
| Greenville County | SC | $101,691,896 | $201 | 507,003 |
| Camden County | NJ | $98,376,054 | $194 | 506,738 |
| Spokane County | WA | $101,547,383 | $201 | 505,505 |
| Adams County | CO | $100,502,964 | $199 | 504,108 |
| Passaic County | NJ | $97,473,818 | $194 | 503,637 |
| Sonoma County | CA | $96,018,973 | $192 | 499,772 |
| Morris County | NJ | $95,535,125 | $194 | 493,379 |
| Lake County | IN | $94,301,324 | $194 | 485,707 |
| Polk County | IA | $95,208,028 | $199 | 479,612 |
| Richmond County | NY | $92,485,196 | $195 | 474,893 |
| Clark County | WA | $94,835,091 | $200 | 473,252 |
| Hampden County | MA | $90,587,294 | $194 | 467,871 |
| Onondaga County | NY | $89,452,165 | $193 | 462,872 |
| Tulare County | CA | $90,552,914 | $196 | 461,898 |
| Prince William County | VA | $91,357,060 | $198 | 461,423 |
| Seminole County | FL | $91,646,669 | $199 | 461,402 |
| Knox County | TN | $91,352,787 | $198 | 461,104 |
| Washoe County | NV | $91,587,038 | $200 | 456,936 |
| Ada County | ID | $93,542,629 | $205 | 456,849 |
| Virginia Beach City | VA | $87,402,174 | $194 | 450,201 |
| Burlington County | NJ | $86,503,822 | $194 | 445,702 |
| York County | PA | $87,224,252 | $196 | 445,565 |
| Santa Barbara County | CA | $86,727,196 | $195 | 444,829 |
| East Baton Rouge Parish | LA | $85,476,302 | $193 | 443,763 |
| Solano County | CA | $86,949,405 | $197 | 441,829 |
| Jefferson Parish | LA | $84,006,695 | $193 | 434,850 |
| Monterey County | CA | $84,311,261 | $195 | 433,410 |
| Pinal County | AZ | $89,891,338 | $208 | 432,793 |
| Lucas County | OH | $83,201,577 | $193 | 431,102 |
| Cameron County | TX | $82,194,452 | $195 | 421,666 |
| Dakota County | MN | $83,332,300 | $198 | 421,453 |
| Sarasota County | FL | $84,249,299 | $201 | 419,496 |
| Berks County | PA | $81,806,170 | $196 | 418,025 |
| Mobile County | AL | $80,261,198 | $194 | 414,114 |
| HillsBorough County | NH | $81,002,217 | $196 | 413,035 |
| Richland County | SC | $80,756,312 | $196 | 411,357 |
| Clackamas County | OR | $81,227,922 | $198 | 410,463 |
| Genesee County | MI | $78,824,418 | $193 | 407,875 |
| Charleston County | SC | $79,910,793 | $199 | 401,165 |
| Waukesha County | WI | $78,510,723 | $196 | 400,475 |
| Loudoun County | VA | $80,324,909 | $203 | 395,134 |
| St. Charles County | MO | $78,088,061 | $198 | 394,290 |
| Pulaski County | AR | $76,124,117 | $194 | 392,967 |
| Orleans Parish | LA | $75,780,898 | $194 | 390,845 |
| Placer County | CA | $77,370,739 | $201 | 385,512 |
| Manatee County | FL | $78,327,168 | $204 | 384,213 |
| Orange County | NY | $74,770,082 | $197 | 380,085 |
| Butler County | OH | $74,419,288 | $196 | 380,019 |
| Forsyth County | NC | $74,256,322 | $198 | 375,195 |
| Lane County | OR | $74,212,036 | $199 | 373,340 |
| Allen County | IN | $73,674,384 | $198 | 372,575 |
| Stark County | OH | $71,985,871 | $193 | 372,404 |
| Collier County | FL | $74,762,701 | $201 | 371,453 |
| Mercer County | NJ | $71,368,970 | $194 | 367,922 |
| Washtenaw County | MI | $71,402,185 | $195 | 367,000 |
| Lehigh County | PA | $71,735,692 | $197 | 365,052 |
| Madison County | AL | $72,433,202 | $200 | 362,276 |
| Nueces County | TX | $70,371,362 | $195 | 361,540 |
| Hamilton County | TN | $71,441,615 | $198 | 360,919 |
| Brazoria County | TX | $72,696,394 | $202 | 360,677 |
| Marion County | FL | $71,009,435 | $201 | 353,526 |
| Westmoreland County | PA | $105,319,216 | $299 | 352,590 |
| Osceola County | FL | $72,985,227 | $207 | 351,955 |
| Anoka County | MN | $69,327,720 | $198 | 350,253 |
| Bell County | TX | $70,493,732 | $202 | 348,574 |
Get Full Estimates Here
Civilytics is publishing aid allocations (when available from Treasury) or aid estimates (for smaller municipalities for which Treasury published populations but not allocations) for 20,000+ local governments in a searchable database available as a public Google Sheet. Access this free resource below:
Total Aid to States and Territories
To understand the scale of these funds, it may be helpful to consider the total aid each state or territory is receiving as part of the American Rescue Plan and the Coronavirus Response and Relief Supplemental Appropriations Act, which provided aid to state and local education agencies (among others).
The following table combines the ARPA allocations published by Treasury with the education allocations published by the U.S. Department of Education to show the total aid to each state. This includes:
- aid for the state/territory itself
- aid for smaller municipalities within the state (disbursed to the state, which will then allocate by municipalities’ population)
- aid to “metropolitan cities” (disbursed directly to those cities as explained above)
- aid to counties (also disbursed directly), and
- aid to state and local education agencies.
The table shows aid for each level of government with all numbers in millions.
Coronavirus Recovery Aid to Local Governments, in Millions
| State | State Aid | Non-Metro Cities | Metro Cities | Counties | Education Agencies | Total |
|---|---|---|---|---|---|---|
| AL | $2,120 | $356 | $431 | $952 | $899 | $4,759 |
| AK | $1,012 | $43 | $53 | $142 | $160 | $1,410 |
| AZ | $4,183 | $227 | $1,003 | $1,414 | $1,150 | $7,976 |
| AR | $1,573 | $216 | $209 | $586 | $558 | $3,142 |
| CA | $27,017 | $1,218 | $7,005 | $7,675 | $6,710 | $49,624 |
| CO | $3,829 | $265 | $551 | $1,119 | $519 | $6,283 |
| CT | $2,812 | $203 | $661 | $693 | $492 | $4,861 |
| DE | $925 | $91 | $64 | $189 | $183 | $1,451 |
| DC | $1,802 | $0 | $373 | $137 | $172 | $2,484 |
| FL | $8,817 | $1,416 | $1,518 | $4,172 | $3,134 | $19,056 |
| GA | $4,854 | $862 | $576 | $2,072 | $1,892 | $10,256 |
| HI | $1,642 | $46 | $197 | $275 | $184 | $2,343 |
| ID | $1,094 | $108 | $124 | $347 | $196 | $1,869 |
| IL | $8,128 | $742 | $2,726 | $2,461 | $2,251 | $16,308 |
| IN | $3,072 | $433 | $848 | $1,308 | $888 | $6,548 |
| IA | $1,481 | $222 | $339 | $613 | $345 | $2,999 |
| KS | $1,584 | $167 | $260 | $566 | $370 | $2,947 |
| KY | $2,183 | $324 | $395 | $868 | $928 | $4,699 |
| LA | $3,011 | $315 | $589 | $903 | $1,160 | $5,979 |
| ME | $997 | $119 | $122 | $261 | $183 | $1,682 |
| MD | $3,717 | $529 | $619 | $1,174 | $869 | $6,908 |
| MA | $5,286 | $385 | $1,665 | $1,339 | $815 | $9,489 |
| MI | $6,540 | $644 | $1,823 | $1,940 | $1,656 | $12,604 |
| MN | $2,833 | $377 | $644 | $1,111 | $588 | $5,554 |
| MS | $1,806 | $268 | $101 | $578 | $725 | $3,478 |
| MO | $2,685 | $450 | $831 | $1,192 | $871 | $6,029 |
| MT | $906 | $86 | $50 | $208 | $170 | $1,420 |
| NE | $1,040 | $111 | $176 | $376 | $243 | $1,946 |
| NV | $2,739 | $151 | $292 | $598 | $477 | $4,257 |
| NH | $995 | $112 | $86 | $264 | $156 | $1,613 |
| NJ | $6,245 | $578 | $1,190 | $1,828 | $1,231 | $11,071 |
| NM | $1,752 | $126 | $171 | $407 | $436 | $2,892 |
| NY | $12,745 | $774 | $6,041 | $3,900 | $4,002 | $27,462 |
| NC | $5,439 | $705 | $668 | $2,037 | $1,603 | $10,453 |
| ND | $1,008 | $53 | $41 | $148 | $136 | $1,386 |
| OH | $5,368 | $844 | $2,175 | $2,270 | $1,991 | $12,649 |
| OK | $1,870 | $238 | $316 | $769 | $665 | $3,858 |
| OR | $2,648 | $248 | $437 | $819 | $499 | $4,652 |
| PA | $7,291 | $983 | $2,335 | $2,841 | $2,225 | $15,675 |
| RI | $1,131 | $58 | $273 | $206 | $185 | $1,853 |
| SC | $2,499 | $435 | $191 | $1,000 | $940 | $5,066 |
| SD | $974 | $65 | $38 | $172 | $170 | $1,420 |
| TN | $3,726 | $438 | $517 | $1,326 | $1,108 | $7,115 |
| TX | $15,814 | $1,386 | $3,377 | $5,676 | $5,530 | $31,784 |
| UT | $1,378 | $187 | $290 | $623 | $274 | $2,751 |
| VT | $1,049 | $59 | $21 | $121 | $127 | $1,377 |
| VA | $4,294 | $634 | $618 | $1,658 | $939 | $8,143 |
| WA | $4,428 | $443 | $770 | $1,479 | $825 | $7,945 |
| WV | $1,355 | $162 | $168 | $348 | $339 | $2,373 |
| WI | $2,533 | $412 | $780 | $1,131 | $686 | $5,542 |
| WY | $1,068 | $48 | $21 | $112 | $135 | $1,385 |
| American Samoa | $479 | $5 | $0 | $11 | $495 | |
| Guam | $554 | $18 | $0 | $33 | $604 | |
| Northern Mariana Islands | $482 | $5 | $0 | $10 | $498 | |
| Puerto Rico | $2,470 | $125 | $801 | $620 | $1,321 | $5,337 |
| Virgin Islands | $515 | $11 | $0 | $21 | $547 | |
| Total | $199,800 | $19,530 | $45,570 | $65,100 | $54,311 | $384,311 |
Methodology
Updated 6/3/21: Treasury has published detailed guidance on how aid will be allocated to non-entitlement units. All of our aid estimates have been updated to reflect the new information from Treasury. The only remaining difference will be in how states certify non-entitlement units and the final population of residents living in those NEUs. As a result, we have removed our methodology statement as it no longer applies to the published estimates. You can read the methodology for the old estimates here. We have also removed the text on how our estimates contrasted with Senate aid estimates as neither set of estimates is relevant now.
Updated 5/18/21: Funding amounts for states, counties, and metropolitan cities now come from the official Treasury allocations. Funding amounts for smaller cities (“non-entitlement units”) are still estimated by Civilytics based on the methodology described below because Treasury is not disbursing these funds directly and, thus, did not provide funding estimates for these municipalities.
- *Data from 2017 Fiscally Standardized Cities database and authors’ calculation. See also Chernick, Howard, David Copeland, and Andrew Reschovsky. 2020. “The Fiscal Effects of the COVID-19 Pandemic on Cities: An Initial Assessment,” National Tax Journal 73, No. 3, (September): 699-732)
- Chernick, Howard, David Copeland, and Andrew Reschovsky. 2020. “THE FISCAL EFFECTS OF THE COVID-19 PANDEMIC ON CITIES.” National Tax Journal, September. University of Chicago Press, 699–732. doi:10.17310/ntj.2020.3.04.
- “Fiscally Standardized Cities.” 2017. Lincoln Institute of Land Policy. https://www.lincolninst.edu/research-data/data-toolkits/fiscally-standardized-cities.
How do you find what ARPA funds are available in your city?
Hi Ephrain, if you click on the “City Aid Allocations” link above, it opens a Google sheet that allows you to select your state, then city, and see how much funding the city received. Does that answer your question?
For california it shows auburn but won’t let you switch the city. please advise.
Hi Randi. Sorry about that. Sometimes when you switch states you have to wait a little bit (especially with a big state like California) so the spreadsheet can get the list of all the cities. I tested it out just now and it seems to be working for Auburn city and switched between a few cities in California and it was working for me.
If you get stuck, you can also send us an email and we can send you the estimates for communities as well.