
Part 1: Using the CRDC to examine who gets arrested where
To pique your interest: Out of 1000s of school districts in the U.S., how many do you think accounted for over half of all school-based arrests of American Indian and Alaska Native students in 2021-22? Keep reading for the answer.
In this newsletter we:
- dive deep into our research on arrests in schools,
- share work on school closures from our friends at Research For Action, including how to minimize harms when school closures are announced,
- and share a new tool Jared co-authored to help districts and SEAs implement user-focused data dashboard design.
Let’s go!
Arrests in Schools: Initial Descriptives from the CRDC
Our June 2023 newsletter announced that we were awarded a research grant from the American Educational Research Association (AERA) Grant Program funded by the National Science Foundation.
Nearly 3 years later, we’re sharing what we found. (Timelines get extended when prioritizing client-driven work. Thanks very much to AERA for granting us a no-cost extension that allowed us to finish our report last September.)
So what did we learn? We wrote the grant to use small area estimation strategies to “get the most” from the Civil Rights Data Collection (CRDC) school arrest data. In this and subsequent newsletters we’ll cover:
- the basic facts about who gets arrested where at school
- which districts arrest lots of students, have high arrest rates, or account for most arrests of students from particular groups (e.g., American Indian/Alaskan Native students)
- the effect of outliers and potential data errors on the credibility and utility of district-student group comparisons
- how these descriptives motivate statistical modeling and what our models show
The CRDC is the only source of data on school-related arrests for all the nation’s public schools and districts. The most recent available data, released in January 2025, are for the 2021-22 school year.
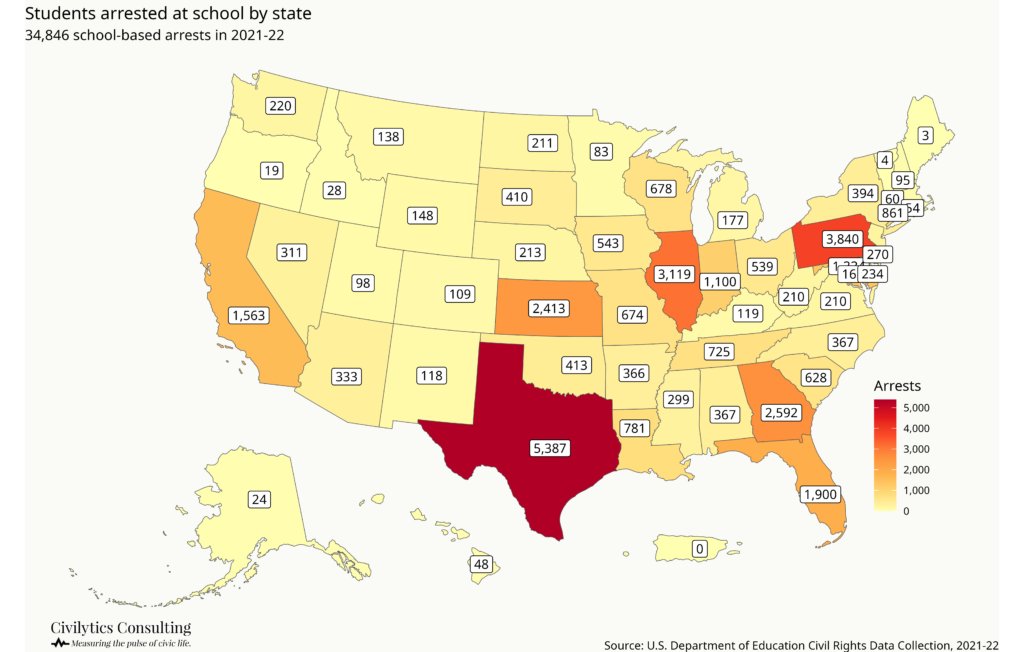
Nearly 35,000 students were arrested in “school-related arrests” in 2021-22.
“School-related arrests” are defined as those taking place on school grounds, while students are taking school transportation, or due to a referral by a school official.
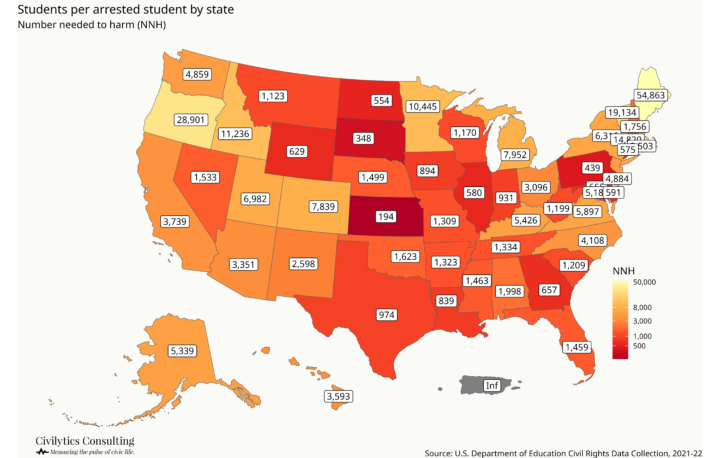
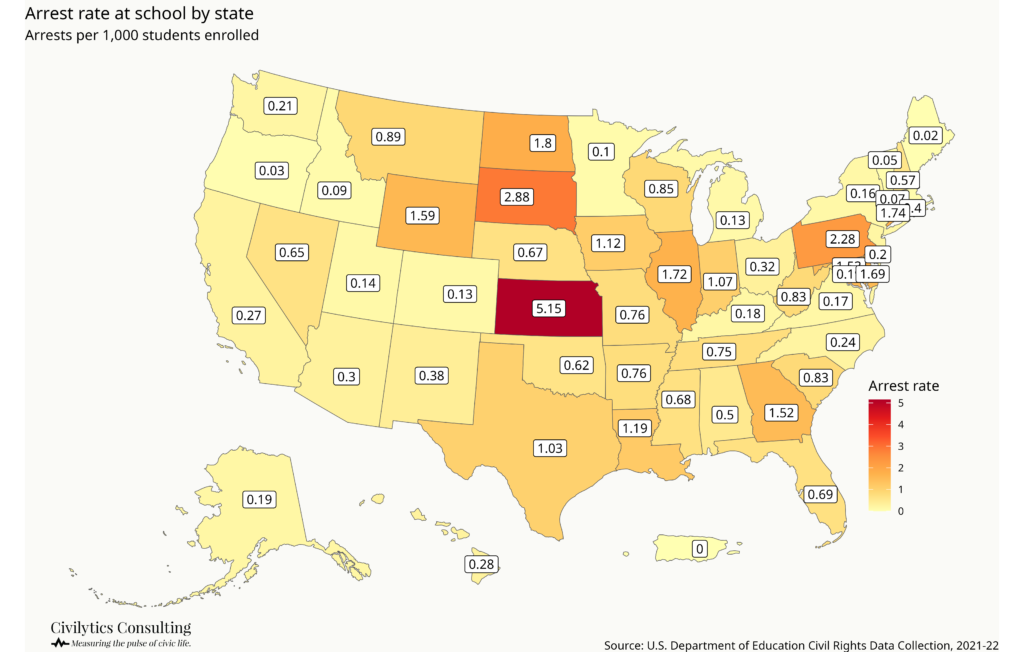
The maps below show how many students were arrested “at school/in a school-related arrest” in each state as well arrest rates by state (maps 1 and 2).
The national school-related arrest rate was 0.72 out of every 1,000 students.
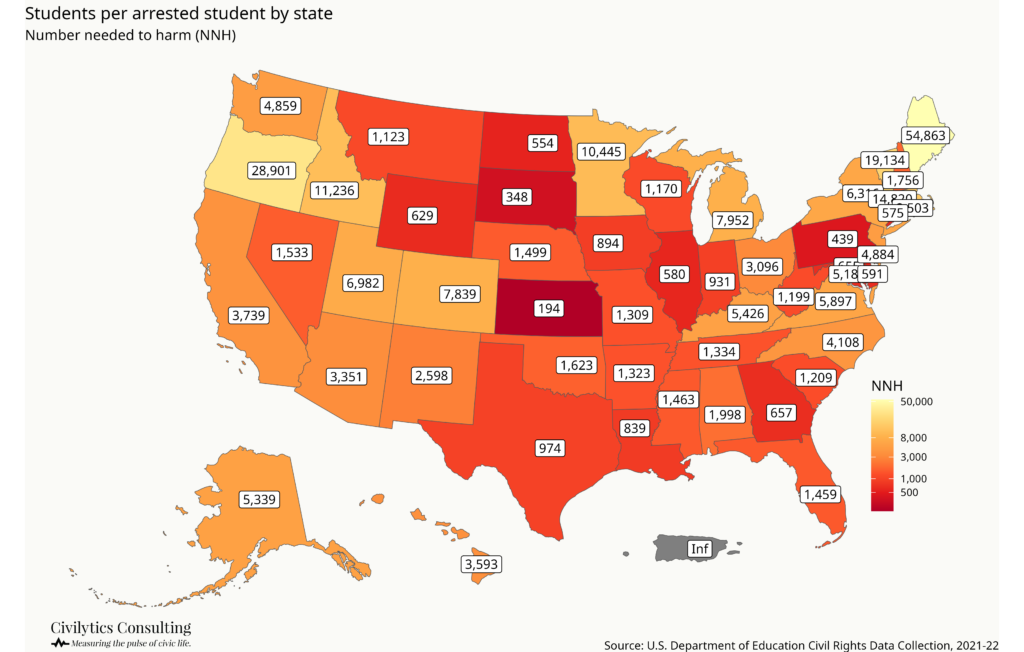
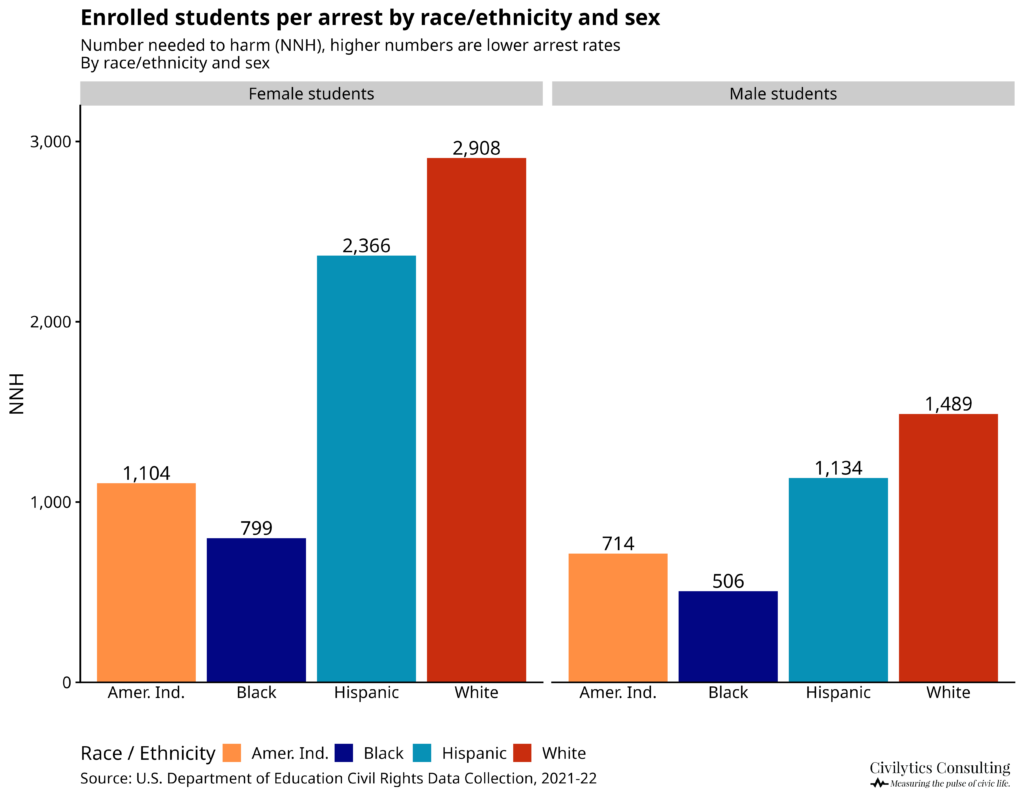
Another approach (borrowed from epidemiology) is to calculate the “number needed to harm” (NNH) or how many students it “takes” before 1 is arrested.
Nationally, 1 out of every 1,428 students was arrested “at school” in 2021-22. In Kansas, 1 out of every 194 students was arrested in schools. In Maine, it was 1 out of over 54,000 students – highlighting the large variance even at the state level.
In our next newsletter, we’ll explore how the variance in these state numbers is driven in part by data errors and how we can use multiple years of data and statistical modeling to address them. For now, let’s continue with some more descriptives.
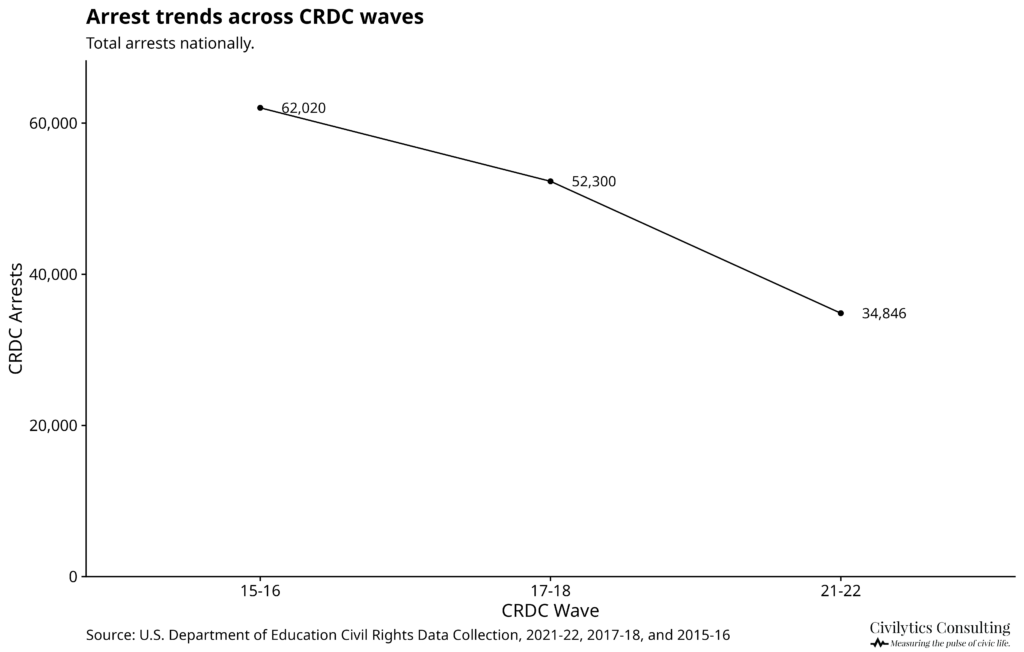
Trends over time
The good news: overall, the number of students with school-related arrests declined by ~40% in the last three CRDC data collection waves,1 from over 62,000 students arrested in 2015-16 to under 35,000 in 2021-22. Correspondingly, the arrest rate declined from over to under 1 student per 1,000.

Disparities by student group
Disparities in arrest rates follow well known patterns with inequities by race/ethnicity, gender, and disability status. There are many different ways to describe these inequities.
- Raw numbers: More Black female students were arrested than White female students despite there being 3 times as many White female students enrolled in U.S. public schools.
- Arrest rates: White students had 0.51 arrests per 1,000 students, Hispanic students 0.65, American Indian/Alaskan Native students 1.16, and Black students 1.62 arrests per 1,000 students.
- The “number needed to harm:” While 1 in about 1,500 White males were arrested at school in 2021-22, 1 in about 500 Black males and 1 in about 700 American Indian/Alaskan Native males were arrested at school in 2021-22.
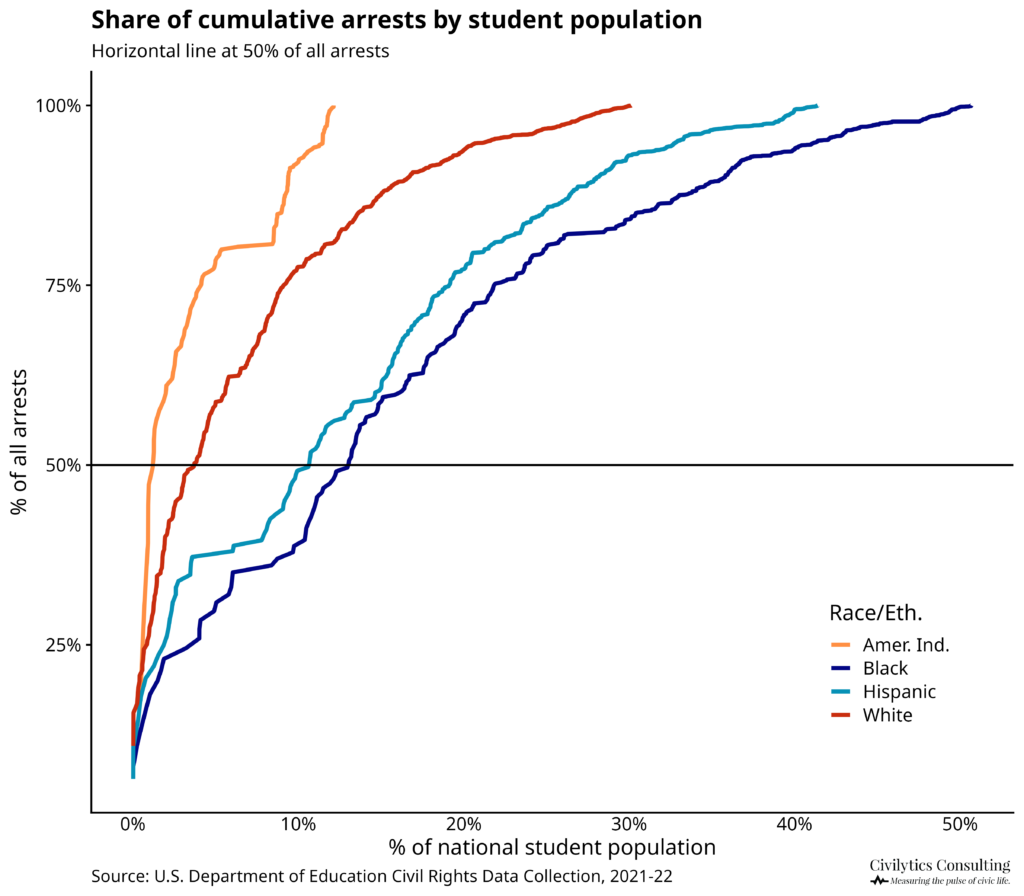
Another way to describe disparities is by highlighting how concentrated arrests of specific student groups are in particular districts, which is partially driven by the geographic concentration of students by race. The line chart below shows the concentration of cumulative arrests by district for four student groups.
Making this chart we learned that over 50% of arrests of American Indian/Alaskan Native students in 2021-22 occurred in just 7 districts.
Districts as the Appropriate Level for Understanding School-Based Arrests
We wrote this grant in large part because we wanted to examine district arrest rates in more detail.
The district level is often the appropriate site of authority for the policies and procedures leading to school arrests and is where individual and collective actors (parents, students, school staff, and elected officials) can have the most immediate, direct, and demonstrable effect. Unfortunately, it’s also where errors or anomalies become more obvious, often leading folks to dismiss what can be learned from data.
Arrests in school are concentrated among a relatively small proportion of districts: in 2021-22, only 11.6% of districts reported at least one arrest. In our next newsletter, we’ll look at district arrest rates in more detail.
This research was supported by a grant from the American Educational Research Association which receives funds for its “AERA Grants Program” from the National Science Foundation under NSF award NSF-DRL #1749275. Opinions reflect those of the author and do not necessarily reflect those AERA or NSF.
How Districts Can Do Better When Closing Schools
Speaking of things that districts partially control: take a minute to think about school closures. We always assumed that school closures were a disruptive but necessary strategy to “right size” school facilities for districts with declining populations…but there’s a lot more to it than that, including some evidence that closures save very little money!
Our friends at Research for Action (RFA) have a new series written by Dr. Alyn Turner that excellently demonstrates the value social science research can bring to school closure policy. The first post focuses on what districts need to know when announcing school closures and how to mitigate harms in the year leading up to a closure. Here’s an excerpt:
The most rigorous evidence on pre-closure effects comes from Chicago Public Schools, which experienced waves of closures between 2001 and 2013. Researchers tracking student achievement patterns found something striking: the largest negative achievement effect occurred during the announcement year—the period between when closure was announced and when students actually moved to new schools.
Students in closing schools experienced approximately 1.5 months of learning loss in reading and 0.5 months in math during this announcement period. Similar patterns have been documented in other districts.
Dr. Turner provides an approachable overview of research on school closures, then quickly turns to giving leaders 8 practical recommendations on how to mitigate negative effects of school closure announcements on student learning. If your district is considering closing school(s), send them this article and be sure to follow the whole series. According to RFA, here’s what’s next:
Coming next: how closures function as neighborhood policy and what happens to buildings after students leave.
So be sure to read the article and follow RFA!
Making Data Dashboards that Inform
In 2023, Jared worked with the Regional Educational Laboratory (REL) Northeast & Islands and the Rhode Island Department of Public Education (RIDE) on a design and feedback process for data dashboards.
RIDE publishes lots of in-depth, high-quality data and analytics for schools, district leaders, and communities, so they wanted to understand how to implement a better design process into the annual updates for their data dashboards.
The team began by holding structured feedback sessions around high-profile existing dashboards. The idea was to gather existing dashboard users and get their feedback on three core areas: usability and functionality, value of the information, and information retrieval. By structuring the feedback process this way, Jared and team avoided what can sometimes happen in less structured settings where feedback can stagnate around a single issue such as a bug in usability or contention around a data definition.
The feedback sessions were a hit, both with users and with the RIDE team! Having user feedback helped the RIDE team prioritize and adapt their development to ensure the dashboards were serving their intended audience and purpose. Bringing user voices directly into design meetings and product roadmaps made it easier to plan and know what milestones were most important to hit. Users felt like their feedback was genuinely being taken into account and this increased their likelihood to keep engaging with the dashboard.
The REL-NEI team created a resource detailing how states and districts can follow a five-step continuous improvement process to build user feedback into their own data dashboard design process. You can read it now here.
I’m so glad to see this resource made it out into the world — and to see that REL-NEI has started back up. Go read their blog for the announcement of this project and the other great work they are doing.
- The CRDC is generally a biennial data collection. We examine data from the most recent year available, the 2021-22 school year, and from two prior collections, 2017-18 and 2015-16. There was also an off-cycle data collection in 2020-21 (due to the pandemic, the planned 2019-20 data collection was postponed). In 2020-21, only about a quarter as many arrests (9,738) and referrals (65,312) were reported as in 2021-22. We do not include 2020-21 data in these analyses because students’ and schools’ experiences during that time varied greatly depending on whether instruction was virtual, hybrid, or in-person along with other factors. ↩︎