Civic Spending Priorities Tool
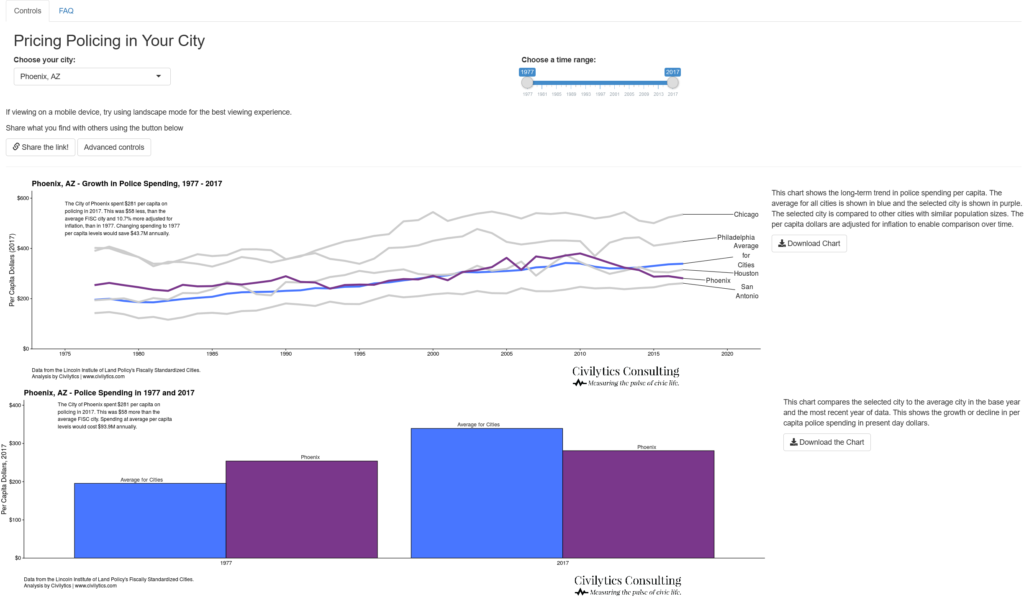
This new tool allows you to explore spending priorities for your city in an apples-to-apples comparison across time and across cities using historical spending data from the budgets of 150 U.S. cities.
Who is this tool for?
This tool is for anyone who wants to understand the services their city and community prioritizes spending public dollars on. Use this tool to learn about how much your city spends now, and has spent historically, on public services.
What should I ask using this tool?
This tool presents five different looks at spending on public services.
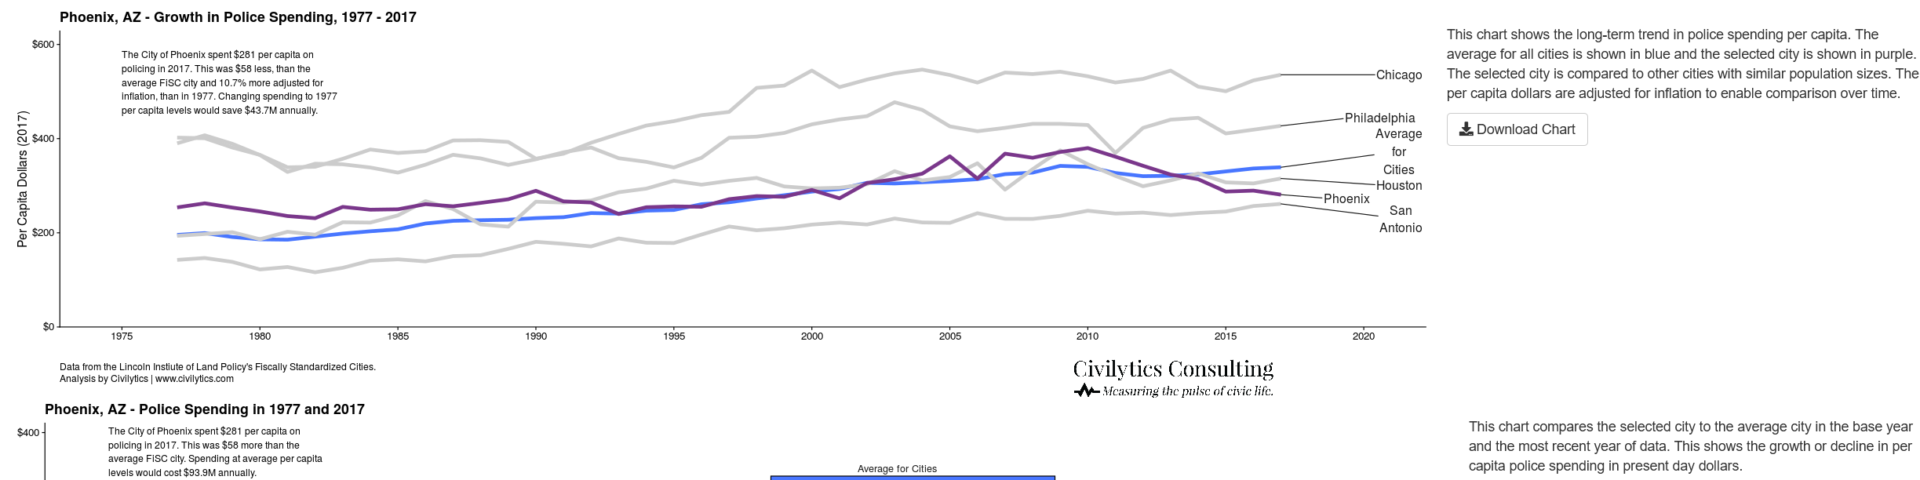
- A trend in per capita spending on policing compared to similar cities in population
- A comparison of per capita spending in a previous year to the present day, adjusted for inflation
- A comparison of per capita spending on 7 different categories of public services
- A comparison of the trends in per capita spending on 5 categories of public services
- A comparison of the cumulative investment of cities in total dollars in different public services
You can export all of the charts as PDFs and also send a link to a specific city and time period to share your results with others!
Where does the data come from?
The Lincoln Institute of Land Policy publishes an annual database of fiscally standardized cities that “makes it possible to compare local government finances for 150 of the largest U.S. cities across more than 120 categories of revenue, expenditures, debt, and assets.” This application uses the most recent data, from 2017, which was published in April 2020.
What is a fiscally standardized city?
From the Lincoln Institute of Land Policy FiSC explainer:
“The FiSC estimates are critical for making meaningful fiscal comparisons at the city level, because the delivery of public services is organized in very different ways in different cities. While some city governments provide a full array of public services for their residents and businesses, others share the responsibility with a variety of overlying independent governments. Fiscal comparisons across central city municipal governments alone can thus be highly misleading.”
Comparisons of city budgets alone would lead us to misunderstand the total investment and scale of services and investment in those services in cities.
Where can I learn more about the Lincoln Institute of Land Policy?
The Lincoln Institute of Land Policy is an operating foundation that focuses on research and analysis to support six goals: low-carbon, climate resilient communities and regions, efficient and equitable tax systems, reduced poverty and spatial inequality, fiscally healthy communities and regions, sustainably managed land and water resources, and functional land markets and reduced informality. You can find out more on their homepage.
Is my city in the data?
The FiSC database includes data on 150 of the largest U.S. cities. The largest city in every state is included as well as most of the largest cities in the U.S. by population. If you live in the largest city in your state or your city has more than a couple of hundred thousand residents, it is likely your data is here.
Why does the data stop at 2017?
The FiSC database uses data from the US Census of Governments. The collection and publication of that data is dependent on audited fiscal data from local and state governments, which are often two to three years behind the current year. In addition, it then takes time for that data to be collected, verified, and prepared for publication. Only then can the good folks at the Lincoln Institute of Land Policy do their analysis to standardize the cities.