
We said we’d have another newsletter coming soon…and we kept our word for once! We strive to be super reliable to clients and always meet their deadlines, but our self-imposed newsletter timelines are another story…
For this edition of The Civic Pulse, we’re kicking off a short series on government budgeting, drawing on a project we began in 2023 for the Institute on Race, Power and Political Economy at The New School. Budget analysis has been a big part of our portfolio since 2019 – you can catch up on that work through a few past newsletters.
Government budgets are in the news right now, but the focus – of course – is the federal budget and its “trickle down” effects. Today we want to focus instead on local budgeting, starting with providing a sense of the scope and scale of local governments as well as the variation in the budgets they produce.
Did you know there are almost 90,000 local governments in the U.S.? That number comes from the Census of Governments (CoG) which collects data on the (U.S.) universe of local governments every five years. At the time of our work, the full 2022 CoG was not yet available, so we used the 2017 version (the most recent full version at the time). But don’t worry, unlike people, new governments tend not to crop up or go away, and local governments’ revenues and expenditures are pretty stable over time, making the 2017 CoG still a great reference.
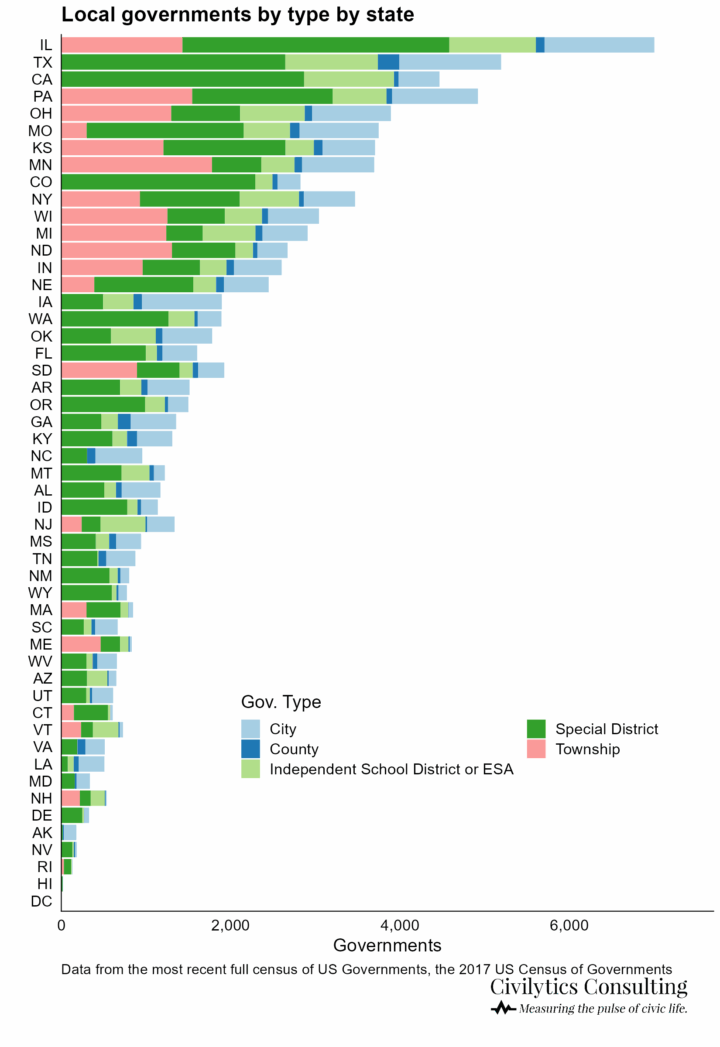
The Census of Governments recognizes 5 types of local governments: counties and county equivalents, cities, townships, school districts, and “special districts.” (If you live in a place without many “special districts,” it’s hard to fathom just how many there are: water districts, fire districts, library districts, mosquito abatement districts, business improvement districts, etc.)
The number of local governments varies dramatically by state, ranging from only 22 in Hawaii to 6,919 in Illinois with an average of 1,767 local governments per state. How does your state stack up?

Categorizing levels of local government across states is harder than you might initially think. For example, the county is the primary legal subdivision of most states but, as anyone familiar with Louisiana knows, it calls its subdivisions “parishes.” And don’t forget about “boroughs” in Alaska. Then there are unique cases of “independent,” “consolidated” or “merged” city/counties which aren’t as rare as you might think. You’ve got:
- “independent” cities like Baltimore, St. Louis, and Carson City
- “fully merged” locales that are both cities and counties like Philadelphia, Honolulu, and Denver
- “consolidated” city-counties that differentiate services and budget costs between the central city and other communities like Nashville-Davidson County and Louisville-Jefferson County
- And places that don’t have county-level governments (e.g., Connecticut and Rhode Island) or have selectively “dissolved” or “abolished” some county-level governments (for example, only 5 of the 14 counties in Massachusetts have functioning county-level governments, one of which, Barnstable County, we worked with on ARPA funding)
All of this makes treating what one city or county spends vs. another less of a guaranteed “apples-to-apples” comparison than you might think. Understanding the levels of local government and how they overlap sets the stage for describing the amount and types of revenue they control as well as the services they provide.
Do you have a project that requires attention to detail, an understanding of local government finances, and the ability to analyze expenditures or economic impacts, or make cross-site comparisons? Reach out! With over five years of experience doing this work across the country, we have a unique perspective and would love to discuss how we could aid your work!
Revenue and Spending
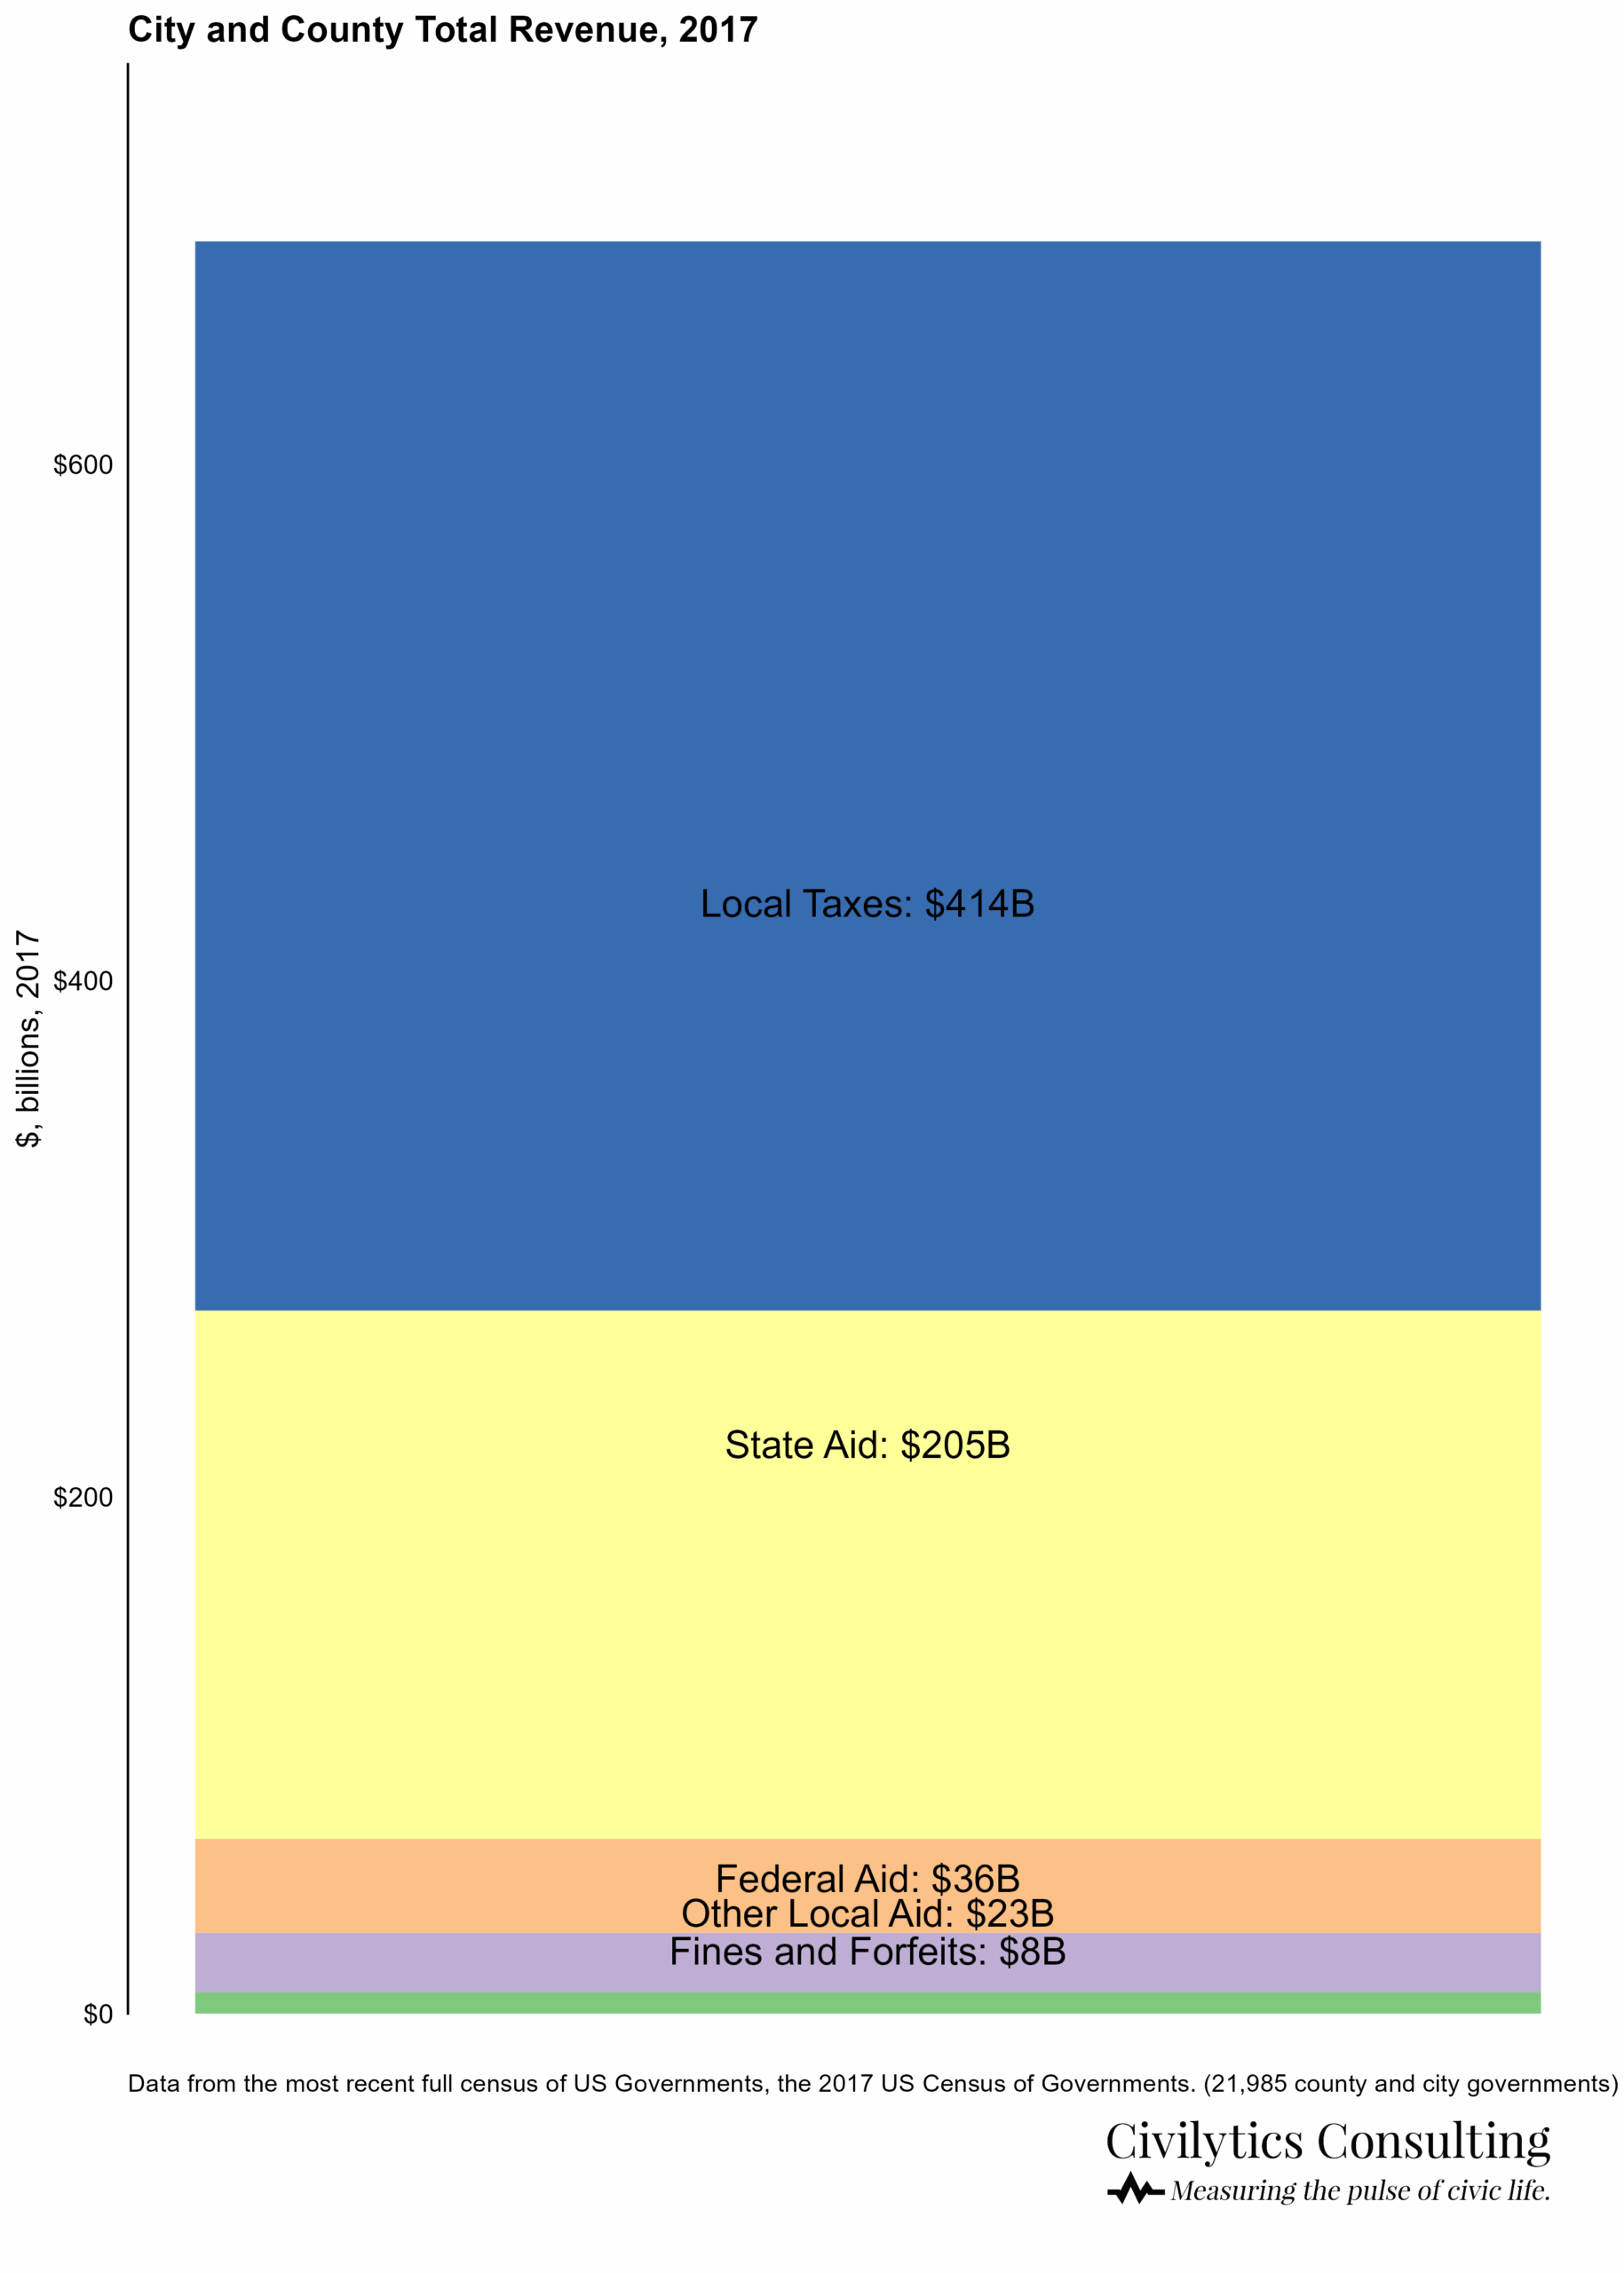
The Census of Governments divides revenue sources into “intergovernmental” versus “own source” revenue. Intergovernmental revenue comes from the feds, state, and other local governments. Revenue from own sources is primarily taxes (including property, sales, individual income, corporate income, and motor vehicle licenses) but also includes charges for service, utility revenue, etc.
While the trillions of dollars in the federal budget get headlines, much of the important work carried out by local governments is predominantly funded by revenues closer to home: local and state taxes. (Some state aid that localities receive is passed through from the federal government.) On average, almost two-thirds of city and county total revenue comes from local taxes, with state aid making up the second largest revenue source.
We often like to highlight for communities with big populations that they spend big money. For example, combined Phoenix and Maricopa County spend more on law enforcement and jails than the entire budget of the Executive Office of the President (~$1.1 billion in FY24). And the budget for LA County is regularly bigger than the entire budget of NASA (~$34 billion) or the Department of Justice ($40.1 billion).
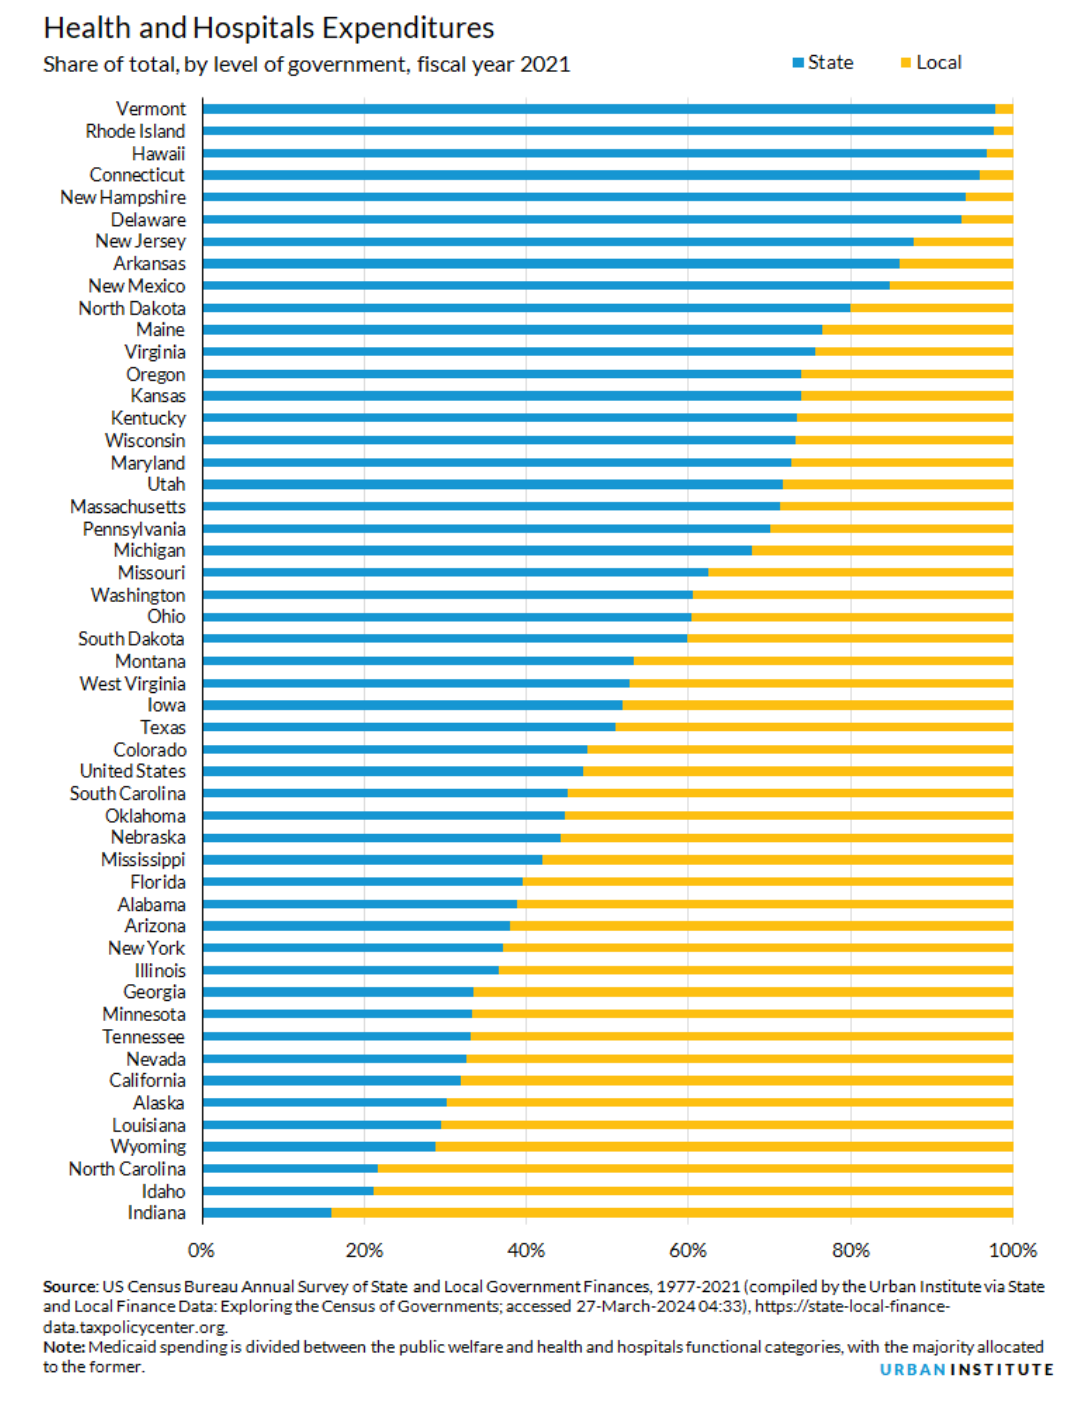
The CoG distinguishes between direct expenditures versus intergovernmental ones. Direct expenditures are what local residents pay attention to and are categorized into issue areas like education, social services, transportation, public safety, and more. Often states, counties, and cities all provide some services within each of these “issue areas,” but the level of government with primary responsibility for a certain service varies by state and is one of the most interesting cross-state patterns to examine, in our opinion.
The Urban Institute’s State and Local Backgrounders project provides a nice overview of patterns of state and local expenditures in each of these areas. For example, Urban shows how responsibility for Health and Hospital Expenditures varies across states, with these activities carried out almost completely at the state level in some places versus mostly the responsibility of local governments in others.
Budget Process
When people talk about the city or county “budget,” they often mean different things. A local government “budget” is at least three things:
- An administrative tool for operating a large organization
- A legislative process legally required to approve spending of public funds and raising of public revenues
- A published document, usually produced annually, communicating #1 and #2
Producing a local government’s operating budget1 is a continuous process throughout the year, not a singular event. The process typically looks like this:
- Department heads meet with the budget director to discuss and submit their requests.
- The budget director or government executive prepares and submits a proposed budget to city councilors or county supervisors.
- Elected officials review the budget and hold hearings on it, recommending changes.
- The city or county executive approves or vetoes changes and publishes the final budget.
- Departments and finance staff monitor actual spending and request supplemental funding midway through the year.
From reviewing well over 100 city and county budgets, we’ve learned that the proposed budget is usually only amended to a minor degree by the approval process.2 There are lots of reasons for this: anchoring bias presented by the proposed budget, a tight timeline for budget passage, information imbalance between the executive and legislative branches, and more. As a result, much of the budget is decided in administrative negotiations with department heads well before the public reveal.
While much of the public attention on the budget dissipates after the “final” budget is adopted, most local governments continue to adjust their budget as the year goes on, often with much less scrutiny at much more sparsely attended public meetings. Here is where adjustments are made that can have a big impact on the current and future budgets, as cities and counties adapt to the changing conditions each year.3
Just as there are stages of producing the budget, there are stages of monitoring and tracking it. At one level, the actual amounts within the budget move through stages from adopted or approved planned spending to estimated or projected spending to actual spending reflecting what happened when all accounts were finalized.
The initial budgeted amounts reflect what the city council or county commissioners have publicly approved departments to spend. Even at this stage, officials and departments may have a sense that the budget for a specific department is likely to be more or less realistic and that a particular department is likely to over- or under-spend. In monitoring the budget, it is important to track not only what is budgeted but what is actually spent. Some departments consistently have over- or under-runs that are in fact anticipated by elected officials.
Comparing Budgets
Budgets present the public with dizzyingly large numbers tied to broad goals like transportation, safety, and education. The budget differs from financial statements in that it is intended to communicate to a wider audience both the allocation of public dollars as well as the reason and intent behind the allocations.
Because the numbers are so much larger and the categories more abstract than what we experience with our own finances (e.g., spending $50 a month on streaming services compared to $1.2 million a year on clean air initiatives), comparing budgets between communities can help. Comparison puts the local budget in context: are we spending more than we need on fire protection? What is a reasonable amount to spend on afterschool programs? Do other places spend more on parks than we do?
Unfortunately, even with the skills and resources of the Census Bureau, comparisons across communities are difficult. This is because budgets are all about categorization—there is no uniform standard for reporting and categorizing government revenue, expenditures, and funds, just some common (but not universal) practices. This lack of standardization means that comparing budgets takes effort, and that budget creators (officials, department heads, and others) have significant opportunities to use the budget as a tool for political communication.

Suffice to say, budgets differ in how they categorize and divide up expenditures and revenue (for example, what is a “fee” in one budget may be a “fine” or a “charge for service” in another) and this does not yet get into broader budget labels. What one budget labels “public safety” may include services such as parking enforcement, mental healthcare, and food inspections, while in another budget each of those items may fall under separate categories. Additionally, what is labeled “public safety” this year could be next year’s “police protection.” Nevertheless, information on each of these general categories—funds,4 revenue, expenditures, and departments—is almost always in each local budget in some form.
Most budgets categorize expenditures into at least personnel, services, supplies, and equipment. However, these categories can have slightly different definitions across jurisdictions and even across years within the same jurisdiction (for example, a vehicle purchase may be classified as a capital expenditure one year and included as equipment in an operating budget another year). More importantly, governments make very different choices in how they allocate expenditures among departments. For example, some jurisdictions centralize all vehicle purchases and maintenance costs, so called fleet costs, within a single department. The costs of vehicles used by all other departments are addressed by transfers between departments, which may or may not be reported within the budget. Other jurisdictions will account for each department’s vehicle costs within that department’s budget.
Budgets are about people, and personnel costs are by far the biggest cost for most government services. In some budgets non-salary personnel costs, such as retirement contributions, insurance premiums, and paid-time-off, are centralized in a single department like human resources. This makes each department’s own budget appear smaller since a large portion of personnel costs are budgeted elsewhere. Other governments account for the full cost of employees within each department. These differences in accounting practice can inhibit comparisons across budgets—and even interpretation within a single budget.
We don’t want to come across as blaming governments for these categorical differences – localities need flexibility in how they organize their finances to carry out their work. But sometimes budgets are incomplete and don’t contain the minimum information needed to understand how the community’s dollars are spent. Budgets often miss information on:
- Staffing: The number of staff in different departments is perhaps the most important piece of budget info that is often missing from budget documents. In a project we conducted that analyzed fiscal year 2022 city and county budgets from almost 40 locales, we found that several large budgets, including Fulton County (Atlanta), Dallas County, and Philadelphia did not contain any information on the number of staff employed by departments.5
- Overtime: In the project described above, only 16 budgets included information on overtime spending in the police or sheriff’s department. Of particular note were budgets that stated overtime spending was a concern but did not provide overtime spending amounts to the public.
- Contract and grant awards: Budgets often include line items for “Contracted Program Services” (LA County’s wording) or “Purchased/Contracted Services” (Atlanta’s wording), but this provides little information to the public on what these services entail or who is providing them. However, we have seen some budgets that list specific contracts, particularly for community-based organizations or organizations serving families and children, providing far more useful information.
Did the content above whet your appetite and make you want to learn even more about local government budgets? Then you should check out our full white paper on The Landscape of Local Government Budgets produced for The New School and available on our website. Even better, we’ll be continuing the series soon with another newsletter on forces that shape local budgets including legal, fiscal, capacity, and social constraints. Our third entry into the series will then describe a pilot local budget equity assessment we conducted with The New School and nine community groups across the U.S.
We hope you’ll stay tuned!
- Sometimes just called “the budget” and, as opposed to their capital budgets, often linked to a strategic plan ↩︎
- While we cannot quantify this in a systematic way without further research, almost all changes from the proposed to amended/adopted budget that we have seen have been on the scale of 5% or less. ↩︎
- These adjustments can be called a supplemental budget, mid-year revision, budget addendum, or quarterly update. ↩︎
- While of little direct interest to the public, funds are a crucial component of understanding budgets because revenues and expenditures are almost always accounted for within funds. Funds are a strategy to balance the need to operate a budget in compliance with finance-related rules against the need to communicate clearly to external stakeholders how money is being used. ↩︎
- At the same time, other large budgets, including for Harris County (Houston) and King County (Seattle), did not show how much departments spent on personnel. The GFOA states that local governments should consider it mandatory to provide a schedule or summary table of personnel or position counts for prior, current, and budgeted years. ↩︎