
Who will study how to retrain education researchers for the new economy?
This edition of the Civic Pulse is off to a cheeky start as Jared was speculating earlier in the week about whether there are currently more coal miners or education researchers. Determining the current number of coal miners – about 40k – is easy thanks to the gold standard source of economic data: FRED. Unfortunately, education researchers don’t get our own labor category so our population count is less clear. The American Educational Research Association (AERA) claims 25k members although that includes students and international members. Considering major contractors like AIR, Mathematica, WestEd, and others as well as myriad researchers at state and local education agencies, we’ve got to be approaching 20,000 or more education researchers right? Will we merit any Emmy-award winning TV shows or Pulitzer Prize-winning books?1
Jared’s offhand question about the number of people employed in these two very different industries got us thinking about what is and may happen with all the researchers – not just education researchers – whose industries are changing so rapidly and whose skills feel pushed aside at the moment.

We know lots of others are feeling this way at the moment and thought it would be a good time to update you all on how things are going here. In our last newsletter we shared our immediate thoughts about a week after much of our work was “terminated for convenience” by the government. (As an aside, we want to thank the many of you who reached out with kind words, your own stories, or an opportunity). In the two months that have elapsed, we’ve been busy, with Jared mostly working on our last big project (due soon) and Hannah mostly applying for new work. While we’ve been grateful to find and apply for a handful of opportunities that seemed like very good fits for our skills and experience, we haven’t been selected for much yet. It’s a tough market out there.
On that note…If you have a short- or long-term project that might be a good fit for us, please reach out! Even if you’re not looking for project assistance at the moment, we’d appreciate it if you could:
- Refer us! Several of the opportunities we recently applied to came from referrals – we are so appreciative of those who connected us with their colleagues, forwarded us solicitations, and recommended us to others.
- Send us info! Do you know of an RFP that might be a good fit for us? A listserv or network we should be aware of? A foundation seeking LOIs? A source for contract work? Please send them our way! Figuring out where to search for work is a challenge and so we’d appreciate any tips in this direction.
We’re particularly looking for the following types of work:
- Program evaluation and evaluation design including both carrying out evaluations and providing technical assistance/advice to others conducting their own research
- Quantitative and qualitative analysis including descriptive research and impact analyses
- Evidence review and synthesis
- Public budget analysis and cost comparisons
- Analysis of jail and prison populations, prison closures, cost of police activity, etc.
Our backgrounds are in education research, sociology, and political science. While we have primarily worked on projects in education (K-12 and higher education), public finance, and carceral systems, we are open to working in other areas and have some experience on projects in child welfare, workforce development/labor, housing, and mental health supports.
On a different note: Jared will be in Denver this weekend so, if you’ll be at AERA or in Denver for another reason, let him know – he’d love to meet up!
While looking for new opportunities, we’ve also taken time to reflect on some of the great projects we’ve worked on. We’ve written four brief “articles” about IES-funded projects we worked on including:
- An Evaluation of Grant Programs to Increase School-Based Mental Health Services. Thinking about this project, we were reminded of just how little is still known about the mental health support provided in schools. A lot has been written about the pandemic’s mental health consequences, including how K-12 students have experienced urgent and ongoing increases in stress, anxiety, and depression. Some has been written about how schools are the most common place students can access mental health services (both for prevention and intervention) and the very high student-to-provider ratios in schools. But, beyond the basics of number of people employed and reported student needs, there hasn’t been a lot of large-scale research on expanding access to school-based mental health resources, including what works in different labor markets and local contexts. In this brief article, we shared some reflections on a project that was just months away from delivering a complete dataset on this topic.
- A Planned Guide on What Works in Promoting K-12 Student Attendance. This project was also incredibly timely “thanks” to the pandemic since student absences increased dramatically almost everywhere in the past few years. Those who aren’t education researchers probably don’t often think about the million different reasons students miss school (some detailed in the post), but the diversity of reasons really calls for a range of different strategies in improving attendance. Schools and districts have been trying a lot but which of these strategies actually have strong evidence that they work not just in one place but in multiple settings? That’s what this contract aimed to answer through a systematic review of evidence-based practices.
- Evaluation Support to Maximize Studies’ Value. This post shared a little about a long-running series of evaluation technical assistance contracts that were canceled. Though Hannah just joined the project about a week before the contract was canceled (!), different iterations of the work had been going on for years with new cohorts of grantees each year. One impressive statistic from an earlier iteration of the project: over 75% of evaluations supported through the project were found to meet rigorous standards for experimental and quasi-experimental designs.
- A Canceled Contract that Aimed to Help Determine “What Works” in Supporting Postsecondary Students’ Success. If you stop to think about it, the sheer variety of higher education students’ goals, from short-term credentials to graduate degrees is incredible as is the range in institutional settings, from small technical colleges to massive state systems at all levels of “selectivity” and institutional support. This makes applying strategies with existing evidence bases challenging. For example, if success coaching was effective for students transitioning from high school to college in one place, will it also help students who are already enrolled in college in a different setting? If so, what adaptations are needed to the content covered, format and frequency of coaching, and so forth? In this project we were providing guidance to five institutions that received Postsecondary Student Success Grants to implement and evaluate evidence-based activities like peer mentoring, success coaching, and financial incentives in new settings.
That’s a rundown of what we’ve shared about our recent education work. We’re still planning to do one or two more write-ups on other canceled projects, including work for two of the Regional Educational Laboratories. In the meantime, we also shared some reflections on a different youth-focused project we’ve loved working on: support for the Youth First Justice Collaborative. The Youth First Justice Collaborative is a network of 15 state campaigns focused on keeping kids out of youth detention centers and building a robust set of alternatives to provide the services that youth need.
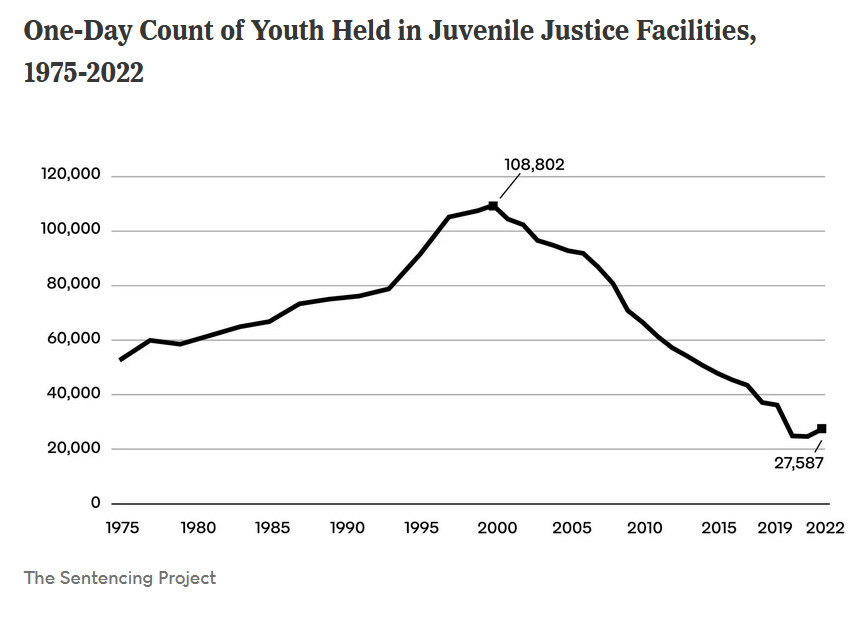
- In this post, we shared a little about the history of how “[b]etween 2000 and 2020, the number of young people incarcerated in the United States declined by an astonishing 77 percent” (source). We also reflected that, at the moment, efforts to further decarcerate youth seem to be facing headwinds, as regressive forces once again push for highly punitive approaches disproportionately affecting youth of color. The post describes some of the work we’ve done for campaigns to analyze state budgets, find information on and price alternatives to detention, and analyze data dashboards and reports. For us, this work has been eye-opening and an interesting contrast to much of our K-12 education work because, while much of K-12 education is highly studied – with studies using rigorous methods and with extensive statistics available – a lot of what happens in juvenile justice centers is still a “black box.” In this area, we’ve found that a little information can go a long way – and that we still have a lot to learn.
We may write up some other reflections on past projects too, things we worked on but didn’t have time to share much about over the past 18 months or so. Look for more of that in a future newsletter perhaps and let us know if there’s any aspect of our work or particular project you’d be interested in reading about!
In the meantime, hang in there. It’s hard to figure out what exactly to say at the moment – it really is a difficult time on so many fronts for so many. We appreciate the virtual community this newsletter (occasionally) provides and we appreciate you reading and sharing. Please reach out or comment below with your own experiences, thoughts, and reflections and of course refer us for work or to resources if you can!
Thank you.
- Despite our jokes, as researchers we feel obligated to say that, of course, the situations and industries are not at all equivalent. Obviously coal mining is a much more dangerous profession with much more serious physical health risks. (Health risks of education research: dry eyes from staring at computer screens, depression from confronting realities of inequality daily.) Coal mining also obviously used to employ many more people (as shown by FRED and by mining’s much larger space in the cultural imagination.) Coal mining also obviously has more negative environmental externalities (negative environmental externalities of this newsletter: Jared’s use of perplexity.ai to try to figure out the number of education researchers). There has been (still is?) a whole set of funding and efforts to support communities and regions negatively impacted “by changes in the coal economy.” ↩︎