
What we learned analyzing data on students experiencing homelessness for Wisconsin’s DPI
In 2024, we worked with the Wisconsin Department of Public Instruction’s Education for Homeless Children and Youth team to analyze data on students experiencing homelessness. We were so impressed by the team’s knowledge of the students and schools they were trying to serve – and were really struck by the number of children experiencing homelessness in Wisconsin, a state not particularly known for this issue.
In this edition of The Civic Pulse we thought it’d be interesting to share what we learned about who these students are, where they attend school, and how they fare on critical educational outcomes. We hope you’ll check out the issue.
A quick note that this was a relatively short project that we were able to complete quickly thanks to Jared’s prior experience with DPI data and the excellent staff at DPI who delivered the data in great shape and asked insightful questions, as well as the focus on clear data insights and graphics that could be used for a variety of internal and external audience rather than on a longer, very polished report.
If the analysis below sparks ideas of ways we could aid your work or you think we might be a good fit for something you need, please get in touch! Hannah is looking to book clients for the next several months. More about our capabilities, services, and philosophy below. If you’re starting up a new project and need extra capacity, scaling up work but aren’t ready yet to make a full-time hire, or have a team member on leave whose responsibilities you need to cover temporarily, maybe we could help!
And a second quick note: before we dive into the data analysis, we want to highlight the federal funding that makes data like this available and that may be at risk for 2026.
The McKinney-Vento Homeless Assistance Act provides critical rights to students experiencing homelessness including the right to remain in their original school if it’s in the student’s best interest and to receive transportation to and from that school. This Act allocates funding to states and districts to be used for program implementation and data collection. Without this funding, this project likely wouldn’t have happened (because the data likely wouldn’t be collected!). More importantly students experiencing homelessness wouldn’t have as much support, including local liaisons in each district working to get them all available services.
For a great profile of one district’s homeless student liaision, check out this 2022 NYTimes article about a liaison in Texas. Please recommend other articles, profiles, or information sources in the comments. (There was an article about homeless students in NYC just last week.)
In June, the Trump administration’s fiscal year 2026 budget proposed consolidating the McKinney-Vento grant program with other programs and dramatically cutting funding, as described by NPR. The House bill rejects this proposal but, given the state of everything U.S. Education Department-related, it’s critical to understand and share with others the importance of these funds to a group of students who already face so many challenges and the schools and educators trying to support them.
Onto Wisconsin…
Over 18k students were homeless in Wisconsin during the 2022-23 school year
It’s always good to start a data project by getting a sense of scale. We began this project by putting the number of students into context. Even with our prior experience working on K-12 education data in Wisconsin, we were really surprised to learn that over 18,000 students were homeless in Wisconsin during the 2022-23 school year. If all students experiencing homelessness were counted together, they would make up the fifth largest school district in Wisconsin!
Table 1: Rank of homeless students among districts by total enrollment in 2022-23
| District | Students |
| Milwaukee | 71,519 |
| Madison | 26,333 |
| Kenosha | 19,809 |
| Green Bay | 19,566 |
| Homeless Students | 18,351 |
| Racine | 16,874 |
| Appleton | 15,529 |
| Waukesha | 12,140 |
| Eau Claire | 11,176 |
| Janesville | 9,855 |
| Sheboygan | 9,800 |
We examined both the school districts with the highest counts of homeless students and the districts experiencing the highest concentration of homeless students. In 2022-23, nearly 4,600 students in Milwaukee Public Schools experienced homelessness. Madison had over 1,000 students experiencing homelessness and Green Bay had nearly 1,000. While the Menominee Indian School District had “only” 155 homeless students, this was over 15% of students in the district. In six other districts, 9-10% of students were homeless that year.
Student characteristics
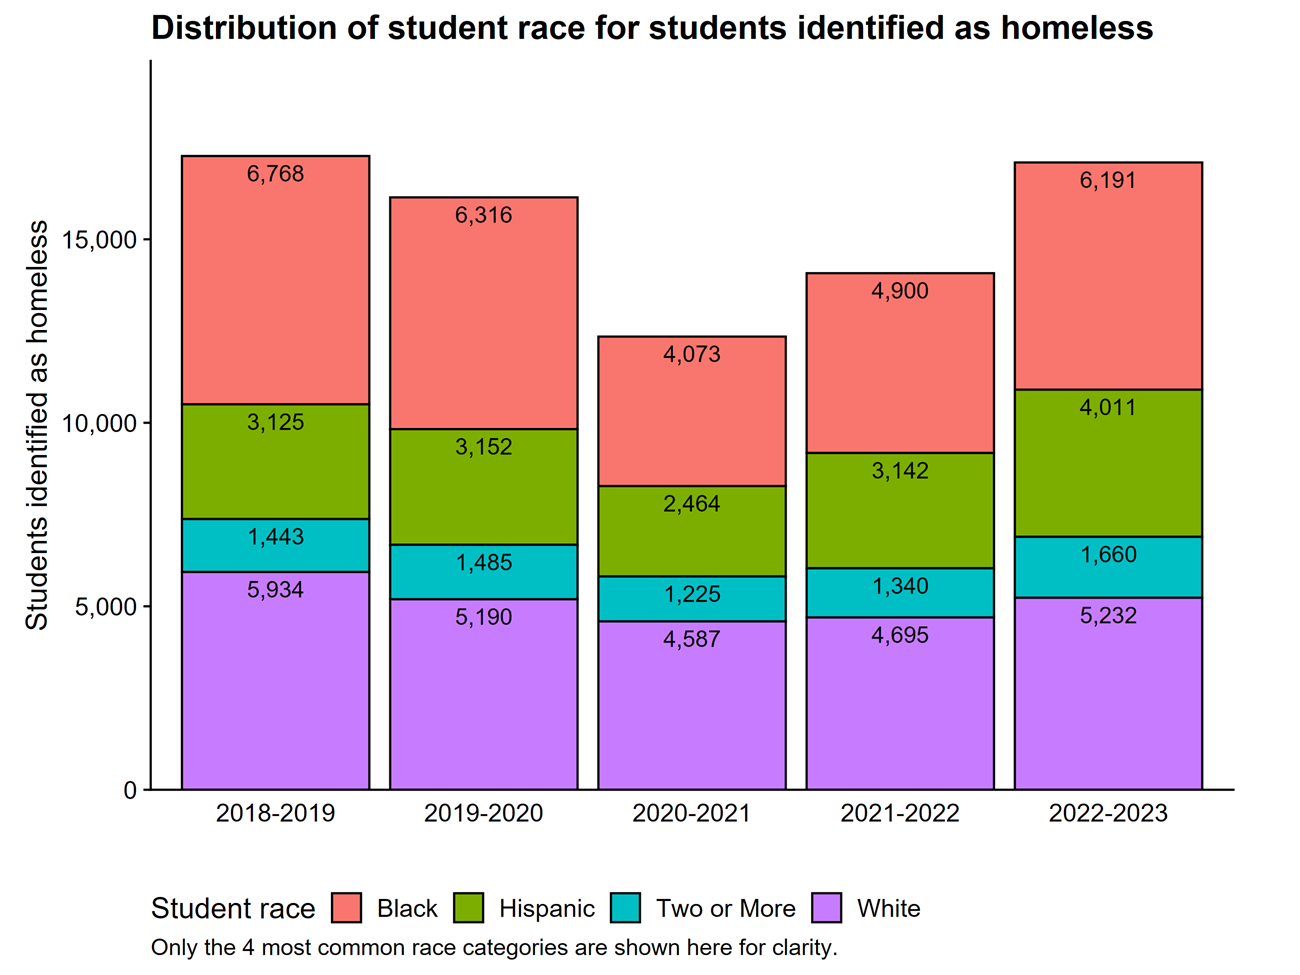
The first question in most K-12 education analyses is: what are these students’ characteristics? While less than 1 in 10 Wisconsin students are Black, over 1 in 3 students who are homeless in Wisconsin are Black. In the 2022-23 school year, there were more Black students experiencing homelessness than White students despite there being about 7.5 times more White students as Black students in the state. Let that sink in.
Among Wisconsin public school students, the general patterns of homelessness by race/ethnicity have remained similar over the past five years, although the share of homeless students who are Hispanic has risen over time. (The number of students identified by schools as homeless dropped precipitously in 2020-21. This is likely partly because of pandemic-related rental assistance and protections and partly because schools were struggling to stay in touch with students and may not have had as much information on students’ homelessness status as usual.)
Each year, around 1% of White students in Wisconsin experience homelessness. In contrast, up to 8% of Black students are homeless. In 2022-23, 1 in every 12 Black students in Wisconsin experienced homelessness. That is just staggering. High percentages of American Indian students also experience homelessness and the percentage of American Indian students who are homeless may be rising. In 2022-23, 1 out of every 15 American Indian students was homeless.
While the share of non-homeless Wisconsin students identified as having limited English proficiency (LEP) has grown slightly over time, the share of homeless students who are LEP has nearly doubled in the past five years. The share of homeless students identified as needing special education services has been relatively consistent over the past five years. However, compared to non-homeless students, a very high share of homeless students are identified as needing special education services: 1 in 4 homeless students need special education services.
Beyond the basic student characteristics
After looking at the “standard” student characteristics usually analyzed in education data, we looked at some data available specifically for this group. With the caveat that this information is based on what schools know — which may paint a less bleak picture than reality since caregivers have an incentive to give a family member’s/friend’s address as their primary location rather than say they’re living in a car or unsheltered and students may feel pressured to say they have an adult with them:
The vast majority of students identified as homeless in Wisconsin are “doubled up,” temporarily sharing housing or staying with friends or family. Each year, about three-quarters of homeless spells are for students who are “doubled up” in someone else’s home. (We focus on homeless spells rather than homeless youth because, with each spell, youth’s living situation may change.) Roughly similar shares of homeless students have nighttime residences that are hotels/motels or shelter/transitional housing. However, the frequency of staying in a hotel/motel appears to have increased slightly over the past five years.
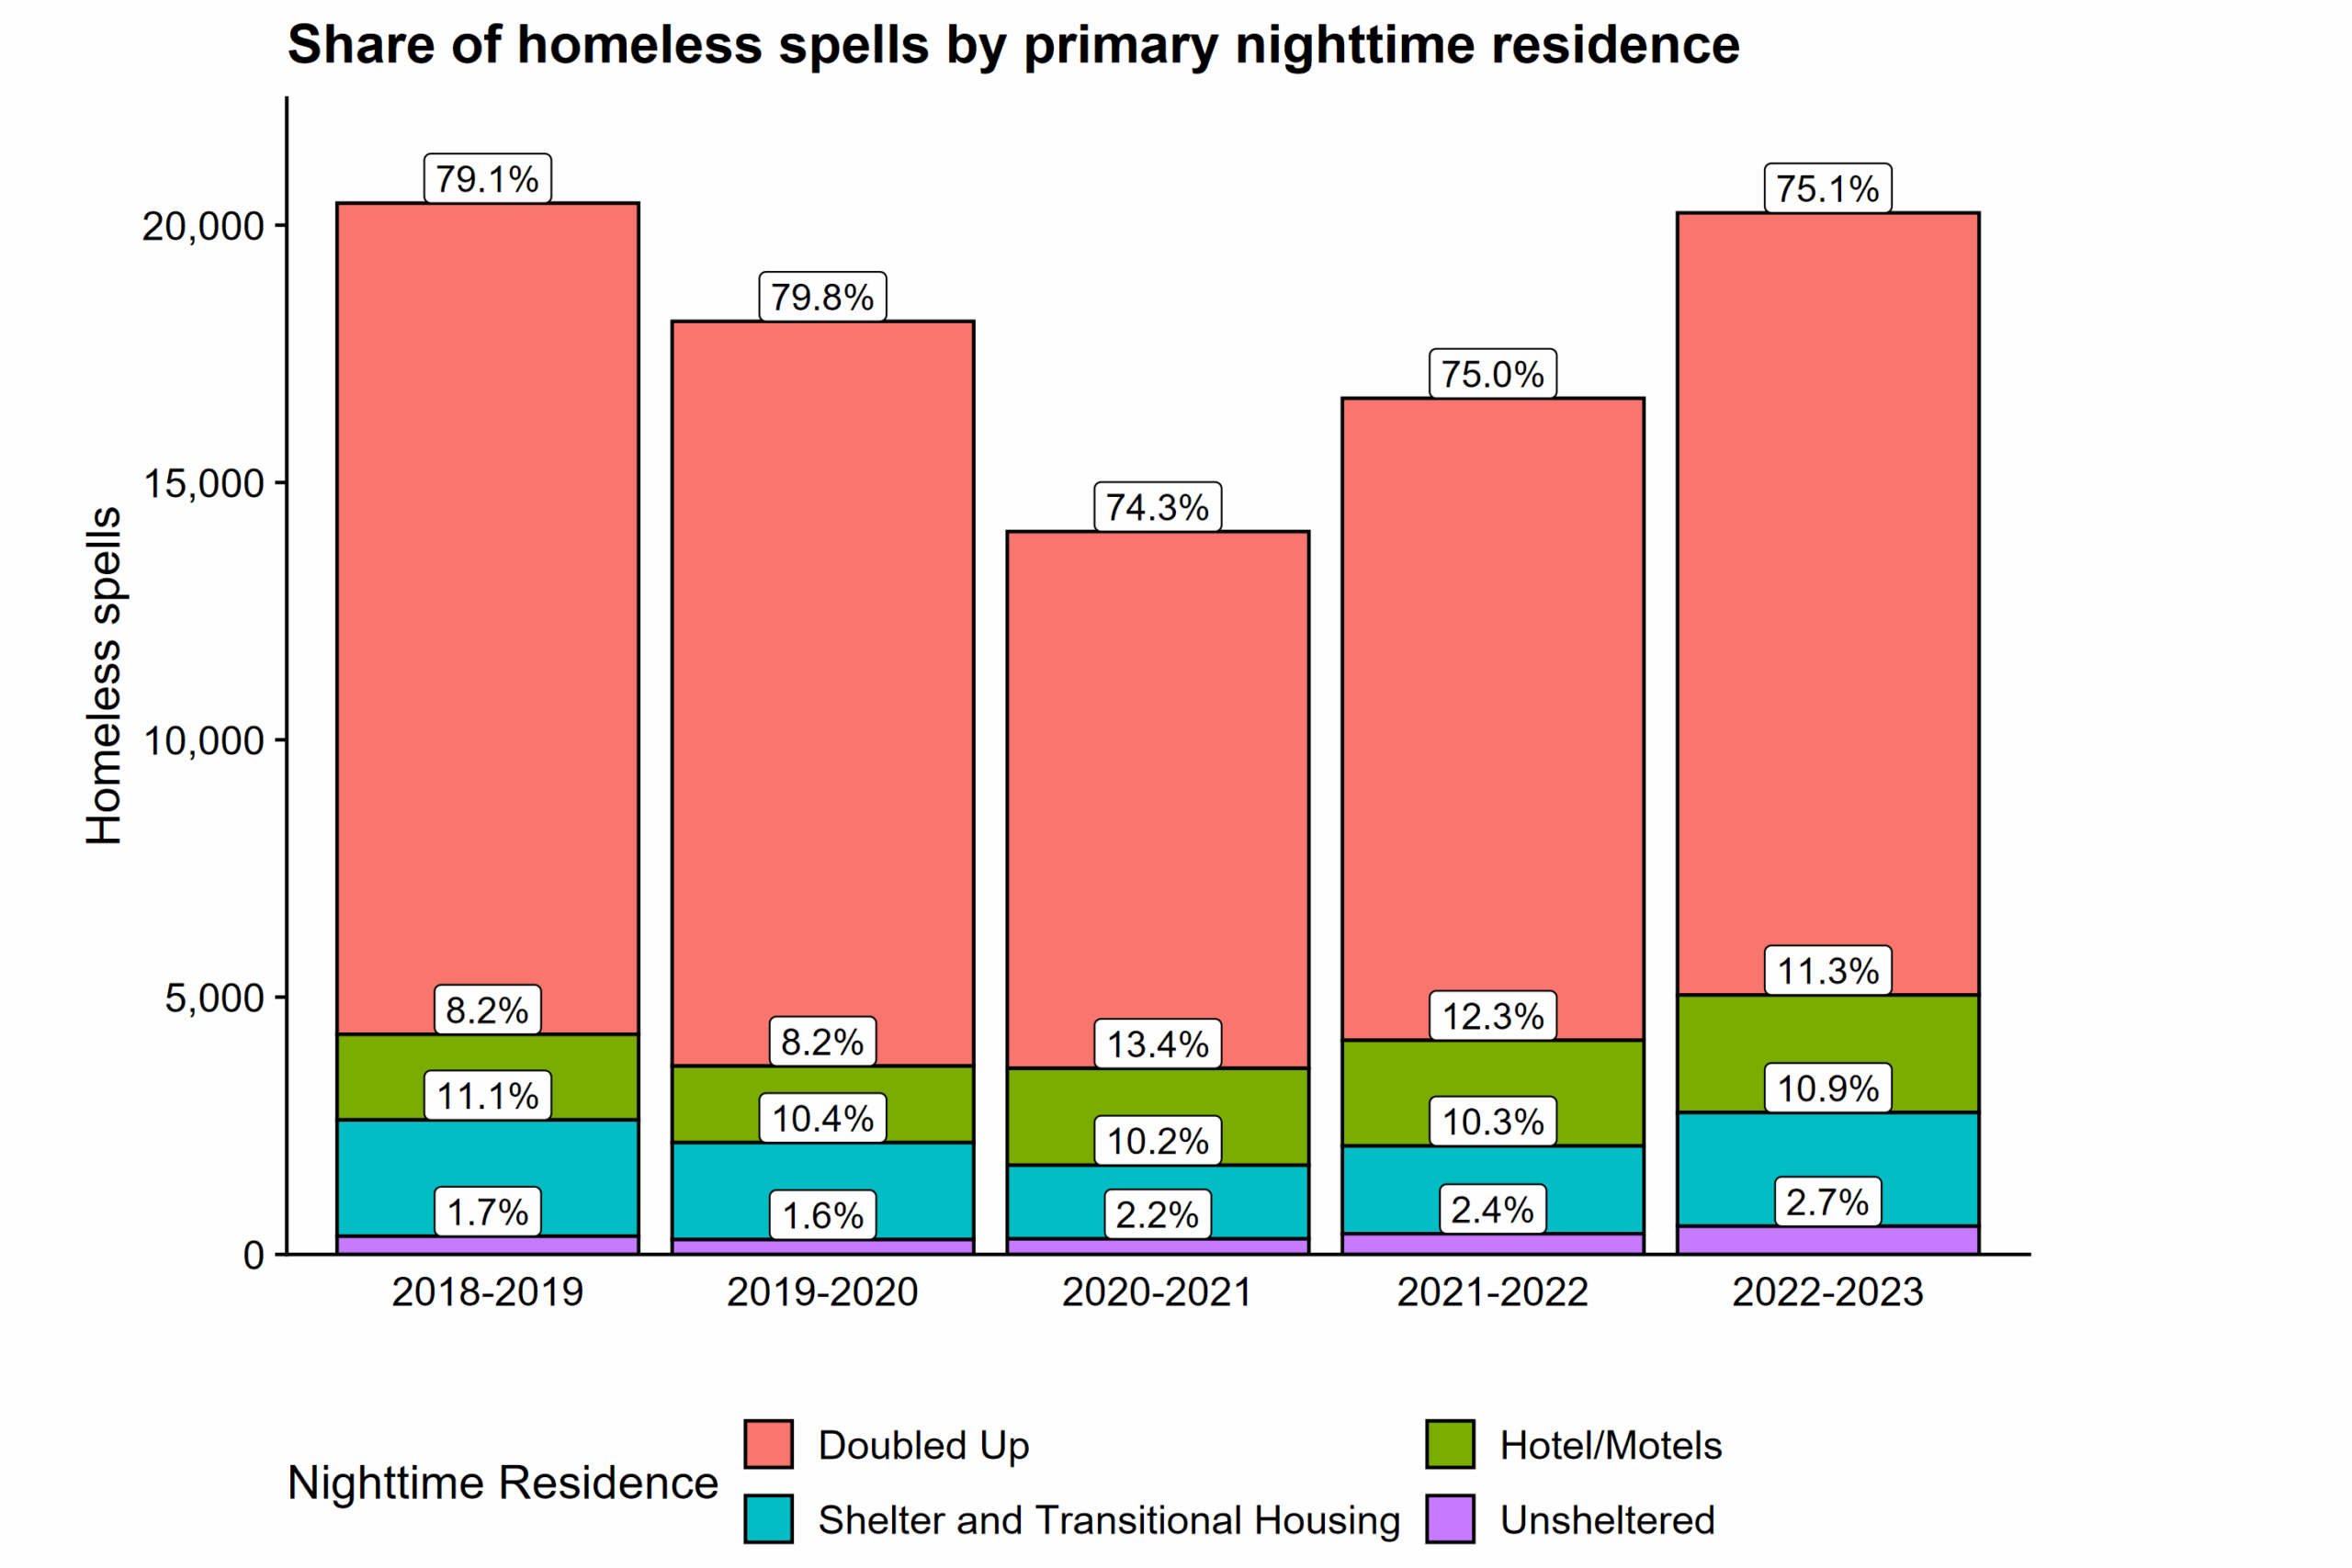
While most homeless youth are accompanied by an adult, some unfortunately are not. Each year around 12% of homeless spells are for youth who are unaccompanied by an adult. (Again we report numbers and percentages of homeless spells, not homeless youth, because youth could be accompanied by an adult for one spell and then unaccompanied in another spell.)
Including students who have experienced homelessness any time in the past 5 years, rather than focusing one year alone, more than doubles the number of students impacted by homelessness. For example, while about 18,300 students were homeless at some point during SY 2022-23, over 40,500 students were homeless at least once between SY 2018-19 and 2022-23. This means, while about 2% of students experience homelessness in any given year in Wisconsin, nearly 5% of students experience homelessness within a five-year period.
Attendance and graduation outcomes
For this project, we looked at the full suite of “typical” education outcomes. Going into the analysis, we already “knew” part of what we’d find: that these students were likely to be struggling more than their peers in many ways.
Students and families experiencing homelessness are dealing with circumstances that honestly most of us cannot imagine — of course, that’s reflected in their outcomes. Therefore, we wanted to start by highlighting some outcomes that we were surprised by and we thought pointed to the resilience of these students and the efforts of the schools trying to serve them.
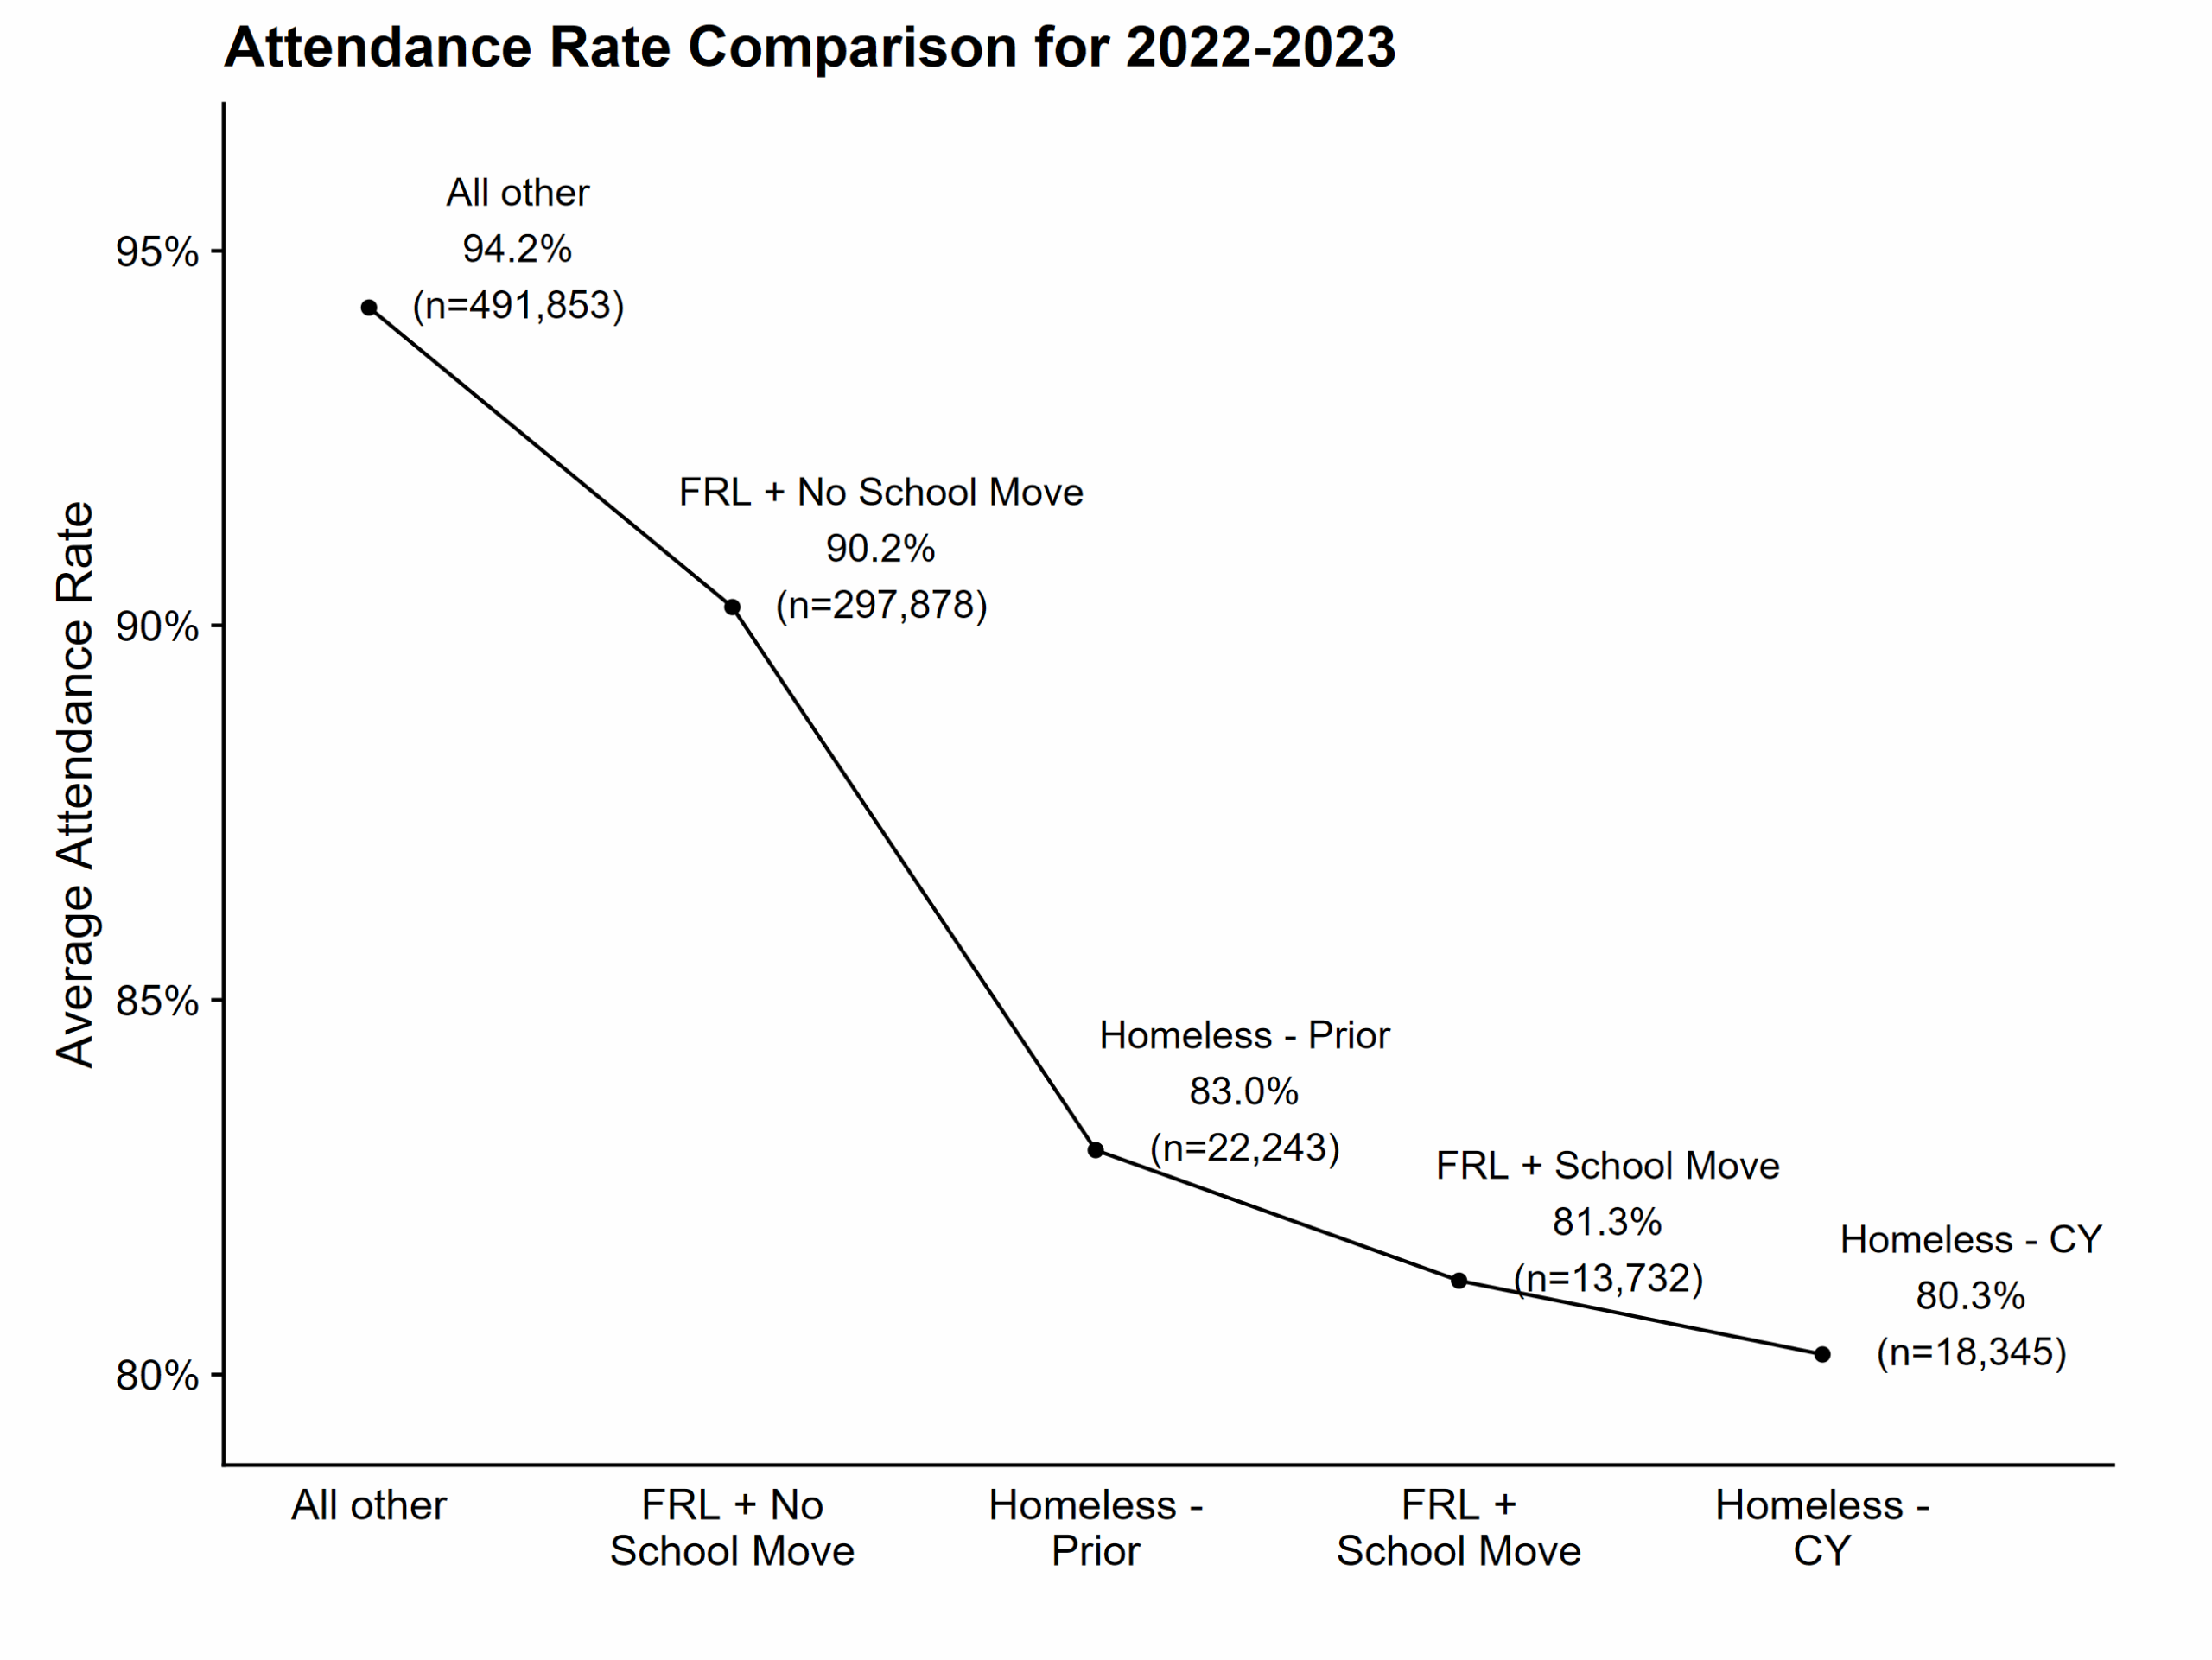
First, Wisconsin public school students experiencing homelessness still attend 80% of school days. While that’s far from ideal from a learning perspective and more than 10 percentage points lower than the attendance rate for non-homeless students, it’s still a lot of days especially considering the effort it may take for some of these students to attend. DPI’s team suggested we compare attendance rates for other groups of students who might also be facing challenging family circumstances, such as students who experienced homelessness in a prior year or students who were eligible for free or reduced-price lunch and had changed schools during the year. Across all groups that we examined, youth experiencing homelessness in the current year had the lowest attendance rate.
Second, despite facing significant challenges, two-thirds of students who experience homelessness in Wisconsin still graduate “on time” and 70% graduate within five years. Compared to other states, Wisconsin has very high graduation rates: 92% of “non-homeless” students graduate on-time. Among students who experienced homelessness at any time during the 5 years prior to their (expected) graduation, graduation rates are 25 percentage points lower: just 67% graduate on-time. However, extending the time frame to five years increases the graduation rate to 71% and we think it’s worth recognizing what it takes for these students, their families, and school to earn a diploma. (Numbers don’t include students who earned a high school equivalency diploma or other high school completion credential.)
State achievement tests
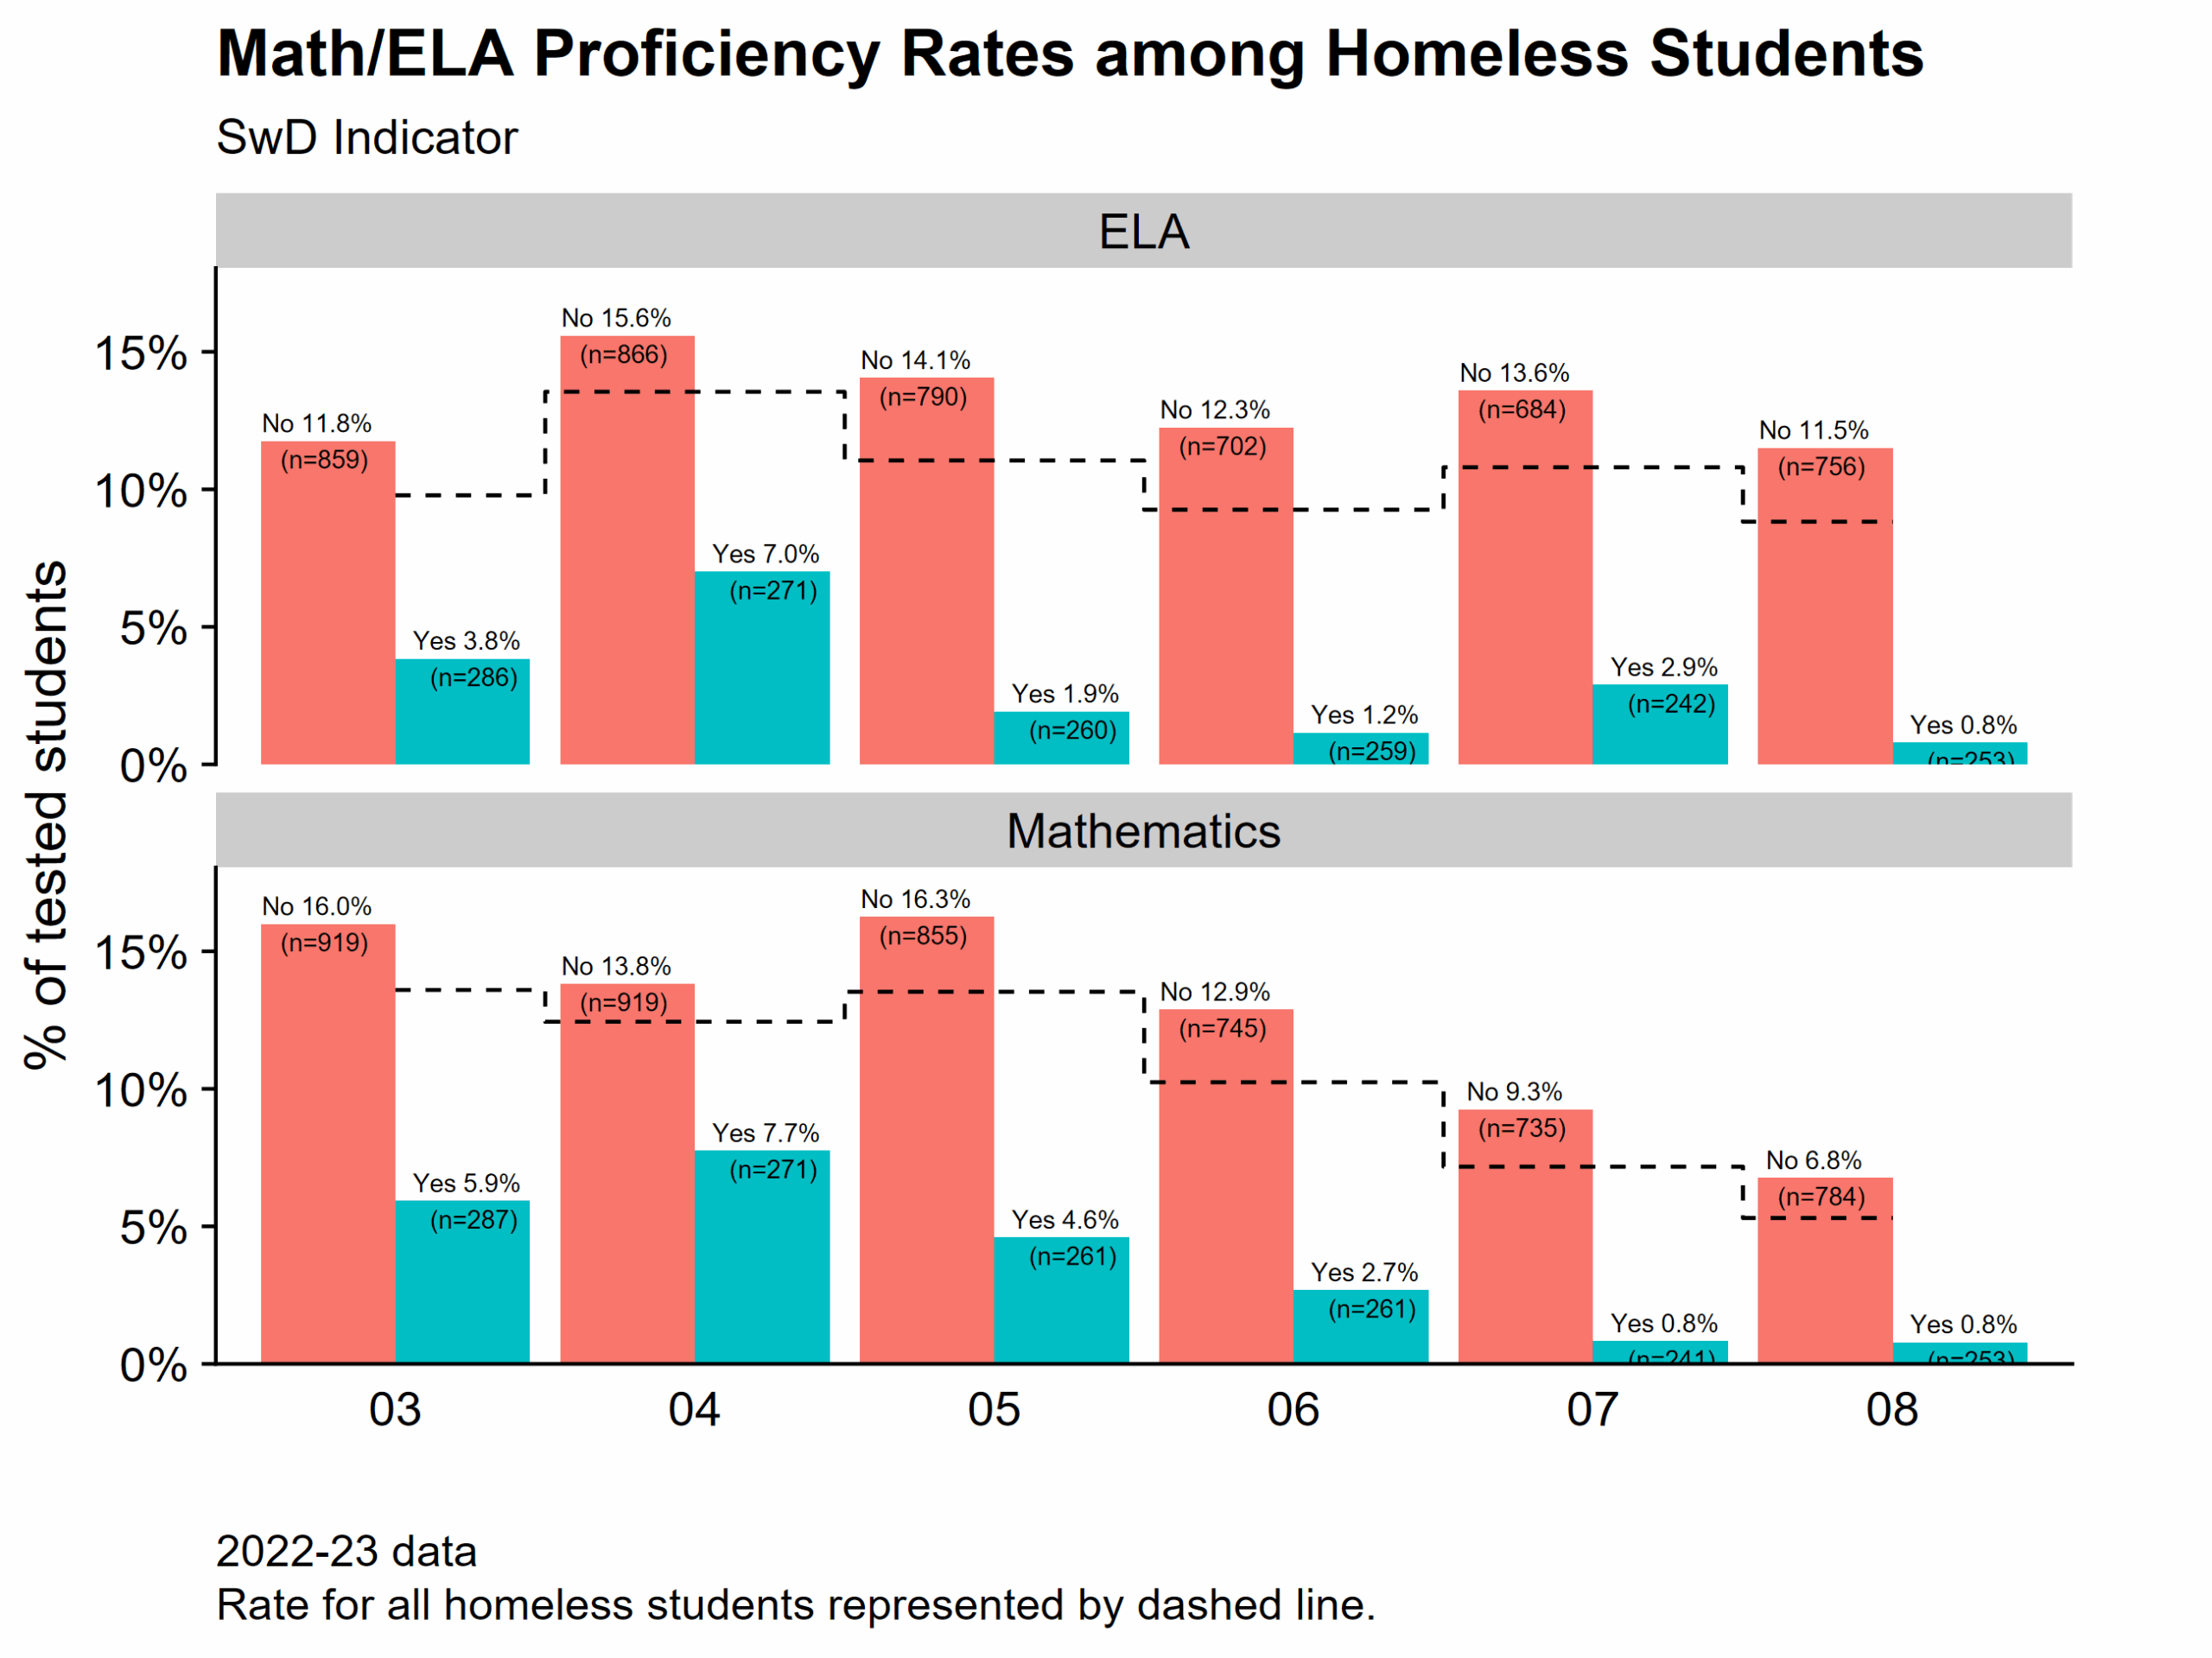
Before turning to proficiency rates, it’s important to recognize that homeless students are less likely to participate in required state assessments. For example, in 2022-23, 96% of non-homeless students but only 86% of homeless students took the required assessments. This likely makes the disparities in proficiency rates appear smaller than they would otherwise be because students who aren’t tested, either because they missed test and make-up test dates or took an alternative assessment for students with the most severe disabilities, would likely have lower than average scores.
In both ELA and math—and in almost every grade from 3 to 8—there is about a 30-percentage point difference in proficiency rates for homeless vs. non-homeless students. Proficiency rates for homeless students range from as low as 5% in grade 8 math to at most a high of 14% (in grades 3 math and 4 ELA). In contrast, the range for non-homeless students is 32 – 50%.
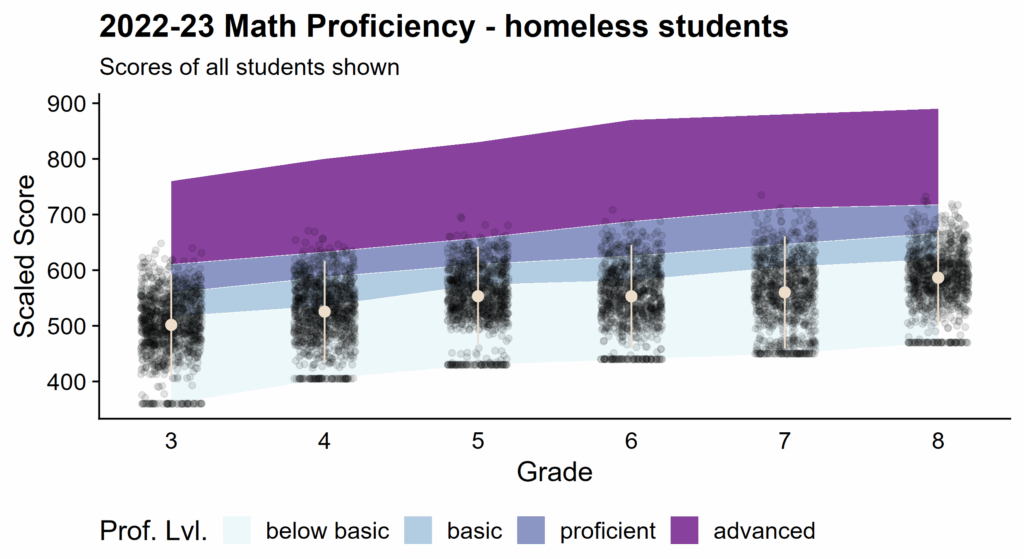
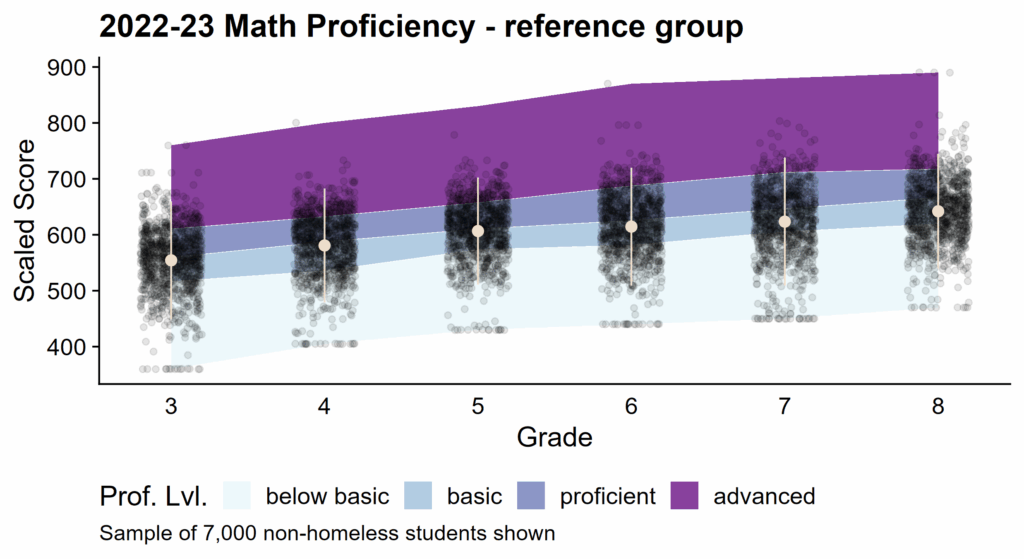
Proficiency rates condense all the details about student scores into a binary decision: proficient or not. The following graphs look at scores in more detail, showing math test scores for all homeless students by grade (top panel) and for a selection of 7,000 randomly selected non-homeless students (bottom panel; because the number of non-homeless students is very large, putting the full data on a chart would make it difficult to see patterns for non-homeless students). The mean (central point) for homeless students in every grade is in the “below basic” range. In contrast, the mean for non-homeless students is in the basic range or even right on the line with the proficient range in grade 3. We see a “pooling” of homeless students at the lowest possible score—in each grade, there is a notable line of dots at the bottom score for homeless students. In contrast, for non-homeless students, we see some students scoring at the lowest possible score, but the number of students is much fewer. Finally, we see more non-homeless students scoring in the proficient and advanced region compared to homeless students and that there are very few homeless students scoring as advanced in any grade (though there are a few).
Patterns are similar for ELA, though with less “pooling” of homeless students at the lowest score possible. We also examined trends in scores over time, scores on the science and social studies tests, ACT/Aspire, etc. While we were able to look across many measures and timepoints, we don’t have many broader takeaways here other than the consistency of continued disparities in all proficiency outcomes in all grades for homeless students compared to their non-homeless peers. These students simply need much more support, on average, to reach proficiency.
Our value-add for this project
One of the things we’re most proud of at Civilytics is our commitment to accuracy, documentation, and verifiability. We live this commitment by delivering the code behind our analytics to the client. With code delivery, we’re committed to clients being able to trace where numbers come from, including what filters and transformations were applied to the data. We’re not saying we never get it wrong or make mistakes, simply that one of our company values is for us and clients to be able to trace back (and correct as needed) where every number came from. As an added benefit to our clients, we always intend that they can pick up the work themselves in the future if they choose. For the Wisconsin Education for Homeless Children and Youth team, we’re especially optimistic that having the code will be useful in enabling this, allowing the team to rerun the analyses with updated data annually.
At Civilytics, we are also proud of our adaptability and responsiveness to clients’ timelines and needs. This project was completed in only five months. While we had a lot of ideas ourselves for what to examine about homeless students’ characteristics and outcomes, the EHCY team also suggested great additional analyses after we shared first drafts with them. We want to do impactful social science analysis and believe the best way to do that is through communication, collaboration, and a commitment to accuracy and transparency. By staying in close communication with clients throughout the analytic workflow, we keep the deliverable aligned to serving the needs of the client and avoid wasted effort.
How we can help
If the values above resonate with you or the analyses we’ve shared sparked ideas of ways we could aid your work, please get in touch!
As mentioned at the start, Hannah is looking to book clients for the next several months. She’s well prepared to pitch in with:
- Project management
- Report and grant writing
- Data cleaning (in R or Stata if you have an extra license/remote desktop)
- Literature reviews
- Survey and interview data collection – including protocol design, recruitment and outreach, piloting, analysis
- Preparing IRB or OMB forms
- All aspects of evaluation design – including preparing and revising logic models/theories of action, identifying metrics, planning data collection, etc.
- Any type of fact/information checking
We loved working with the DPI team to learn a somewhat-new-to-us subject and help them better understand the characteristics and outcomes of the students they serve. We’d love to learn more about your team’s work as well and see if we could be a good fit!
Coming next
We often say we’ll have another newsletter coming soon…and then 6 months goes by. But this time we mean it! Our next newsletter will highlight work on local budget equity and advocacy that we did for and with the Institute on Race, Power and Political Economy at The New School and nine community groups across the U.S. Keep an eye out for that later this month!